webPOISONCONTROL® data analysis dashboard
Analyzing webPOISONCONTROL data indicates that you agree to our Terms of Use.
Table of contents
Age and sex
Geolocation
Routes
Substances
Symptoms
Trending
Triage follow-up and outcomes
Age and sex
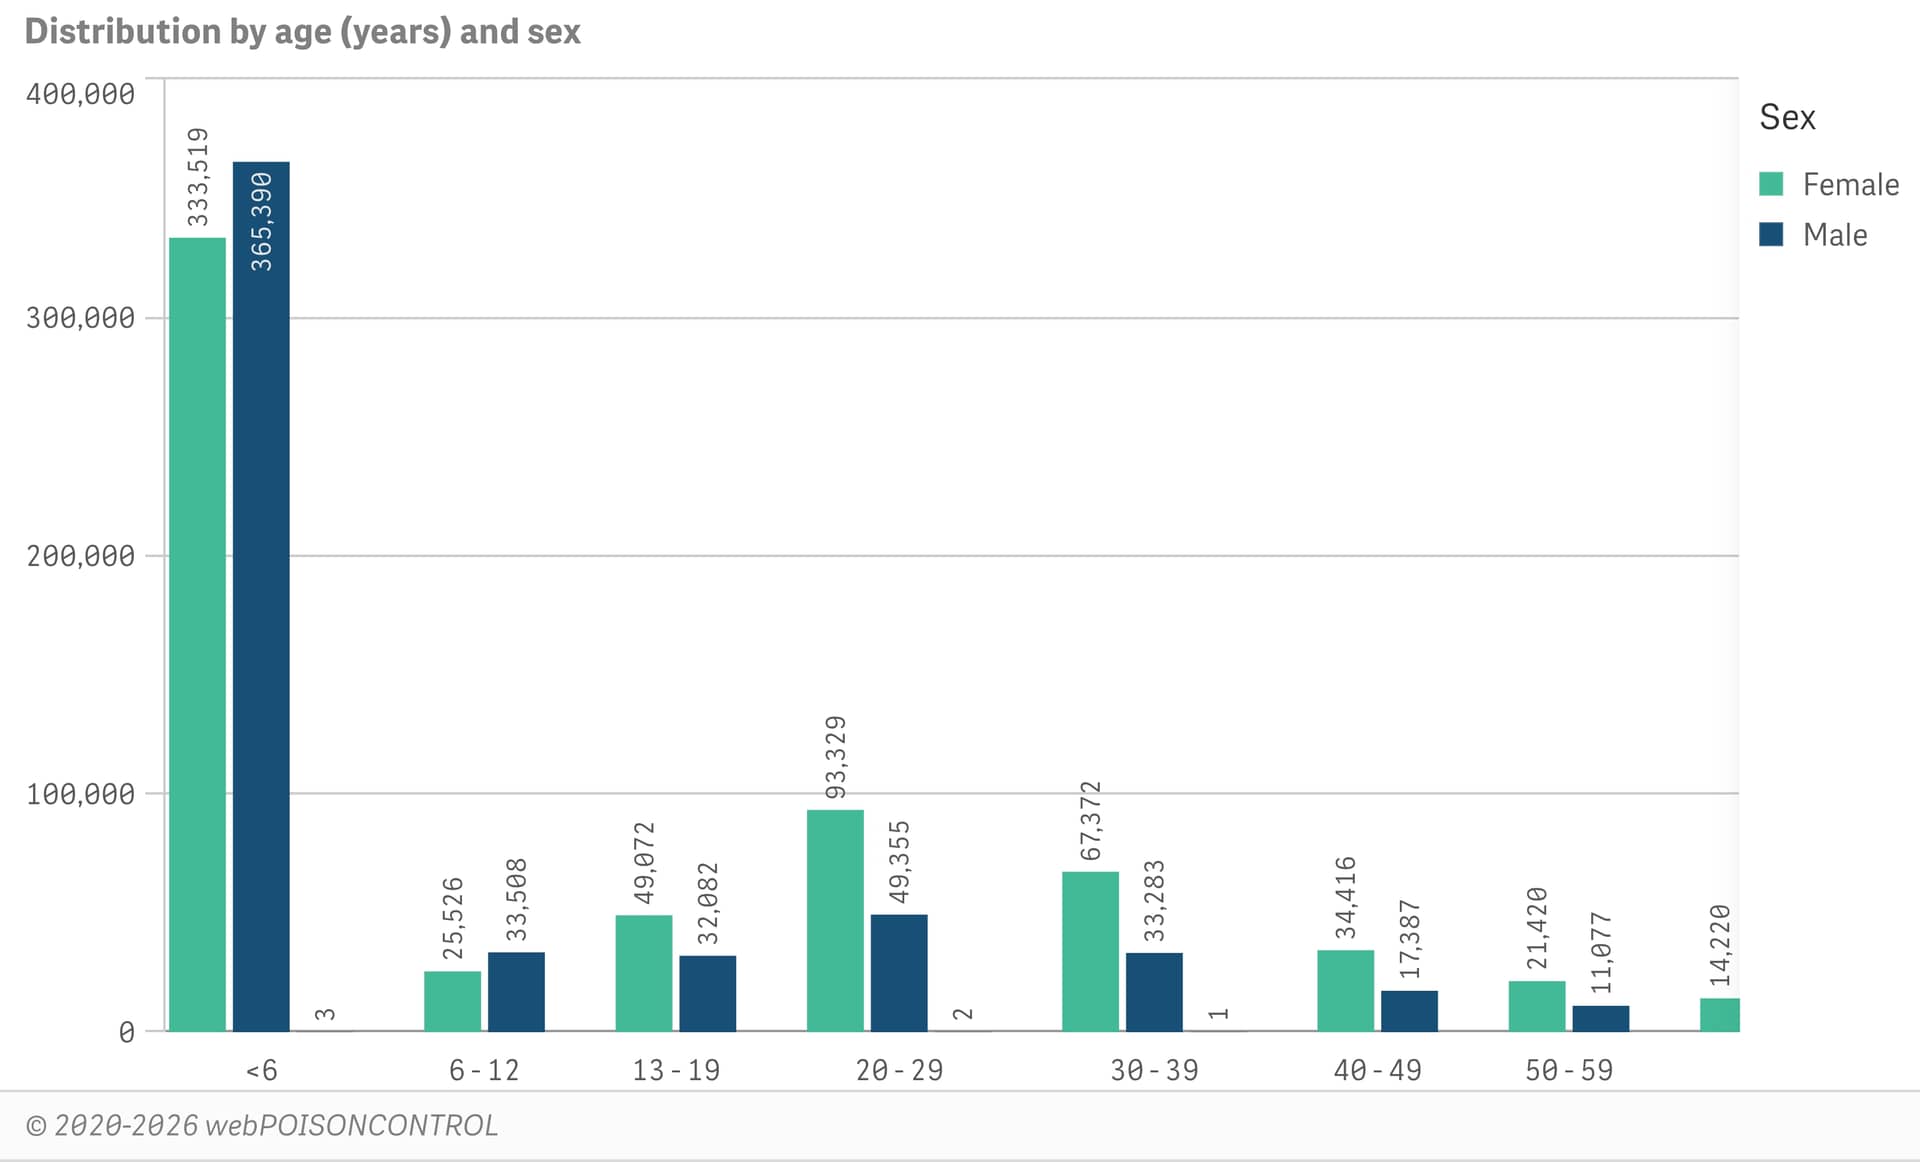
Age by sex
Shows count or percentage of cases by age group by sex for completed, nonduplicated webPOISONCONTROL cases. Ages are grouped as <6, 6-12, 13-19, 20-29, 30-39, 40-49, 50-59, 60-69, and 70-79 years. webPOISONCONTROL does not provide triage recommendations for infants younger than 6 months or seniors over 79 years due to the unique characteristics of poisonings in these more vulnerable age groups.
Click to enlarge the chart and apply filters to the age and sex distribution by substance category, route, triage recommendation, outcome, month/year, etc.
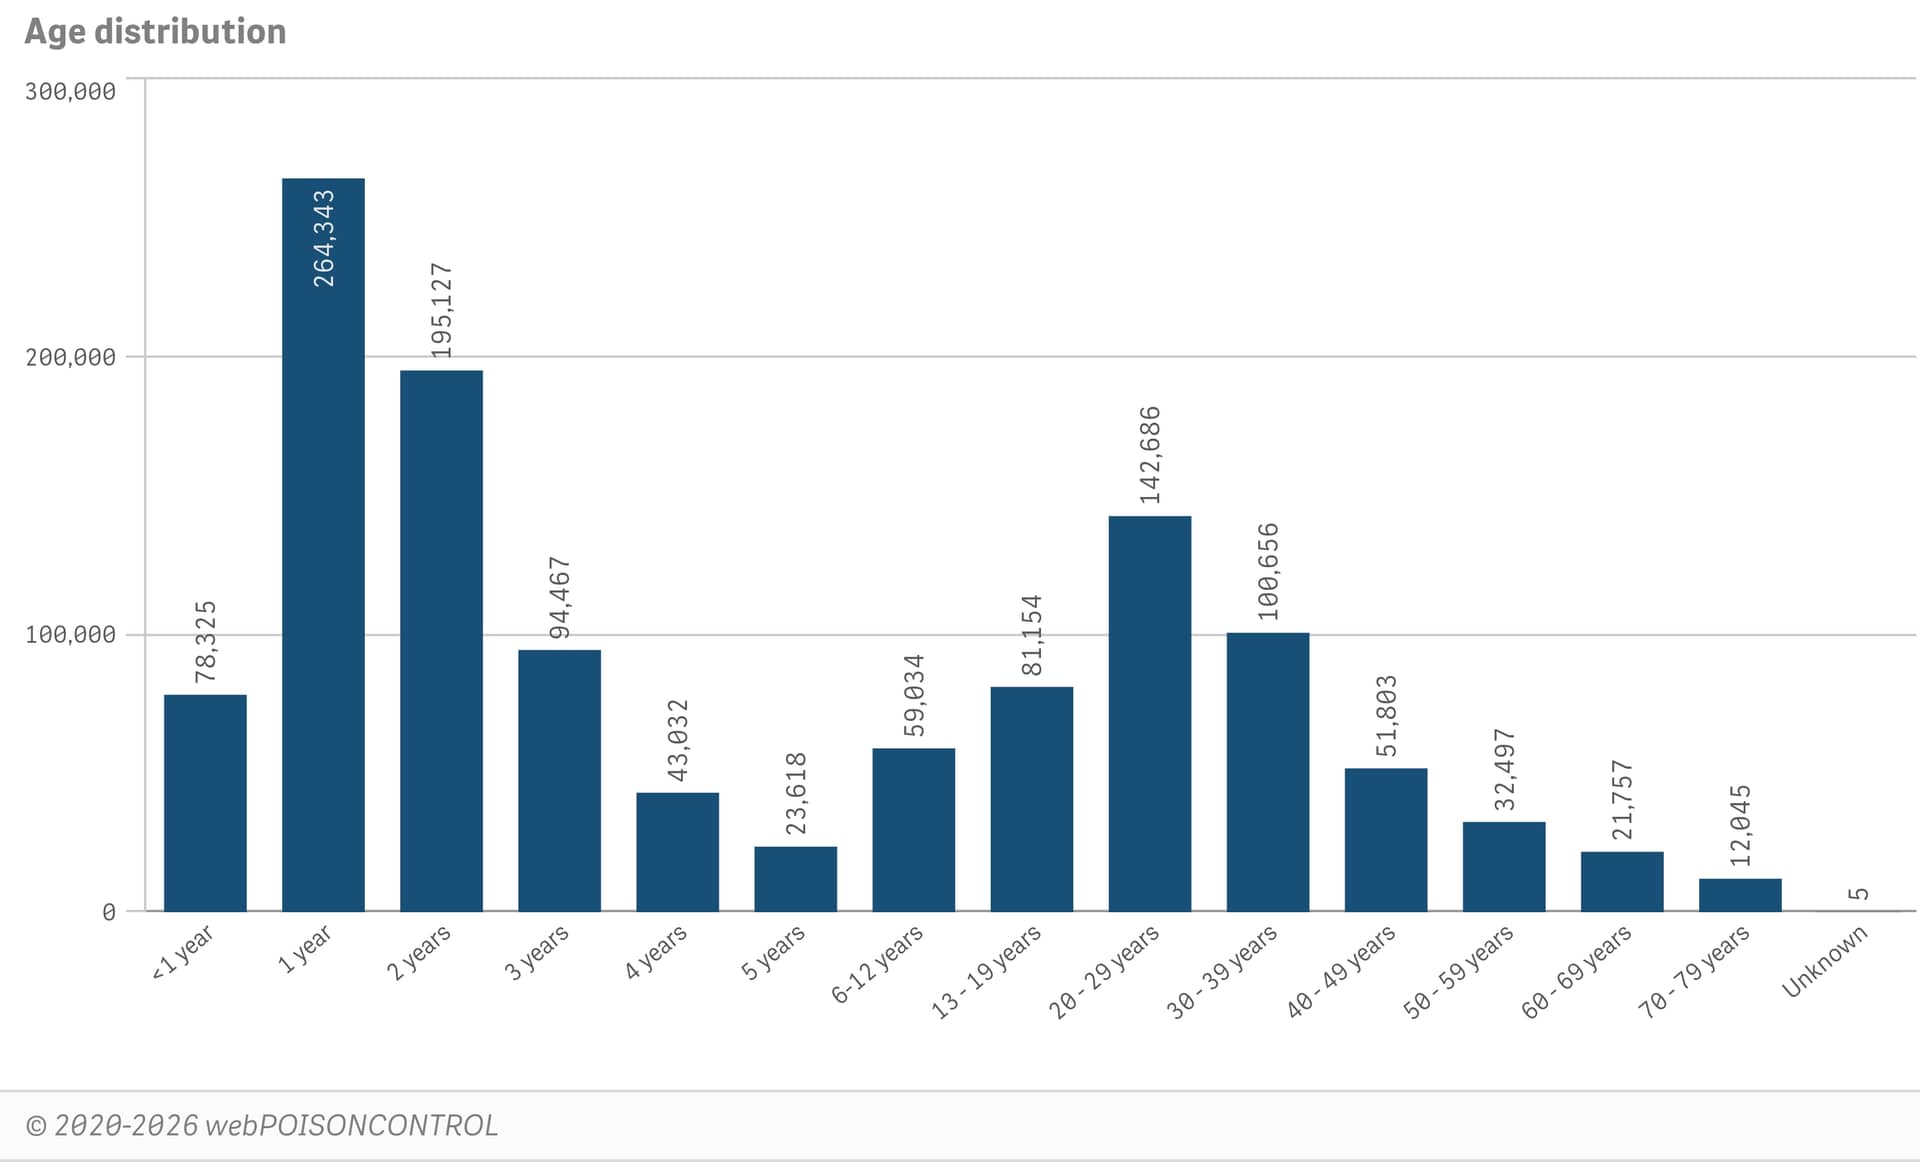
Age distribution
Shows count or percentage of cases by age for completed, nonduplicated webPOISONCONTROL cases. Ages are grouped as <1, 1, 2, 3, 4, 5, 6-12, 13-19, 20-29, 30-39, 40-49, 50-59, 60-69, and 70-79 years. webPOISONCONTROL does not provide triage recommendations for infants younger than 6 months or seniors over 79 years due to the unique characteristics of poisonings in these more vulnerable age groups.
Click to enlarge the chart and apply filters to the age distribution by substance category, route, triage recommendation, outcome, month/year, sex, etc.
Geolocation
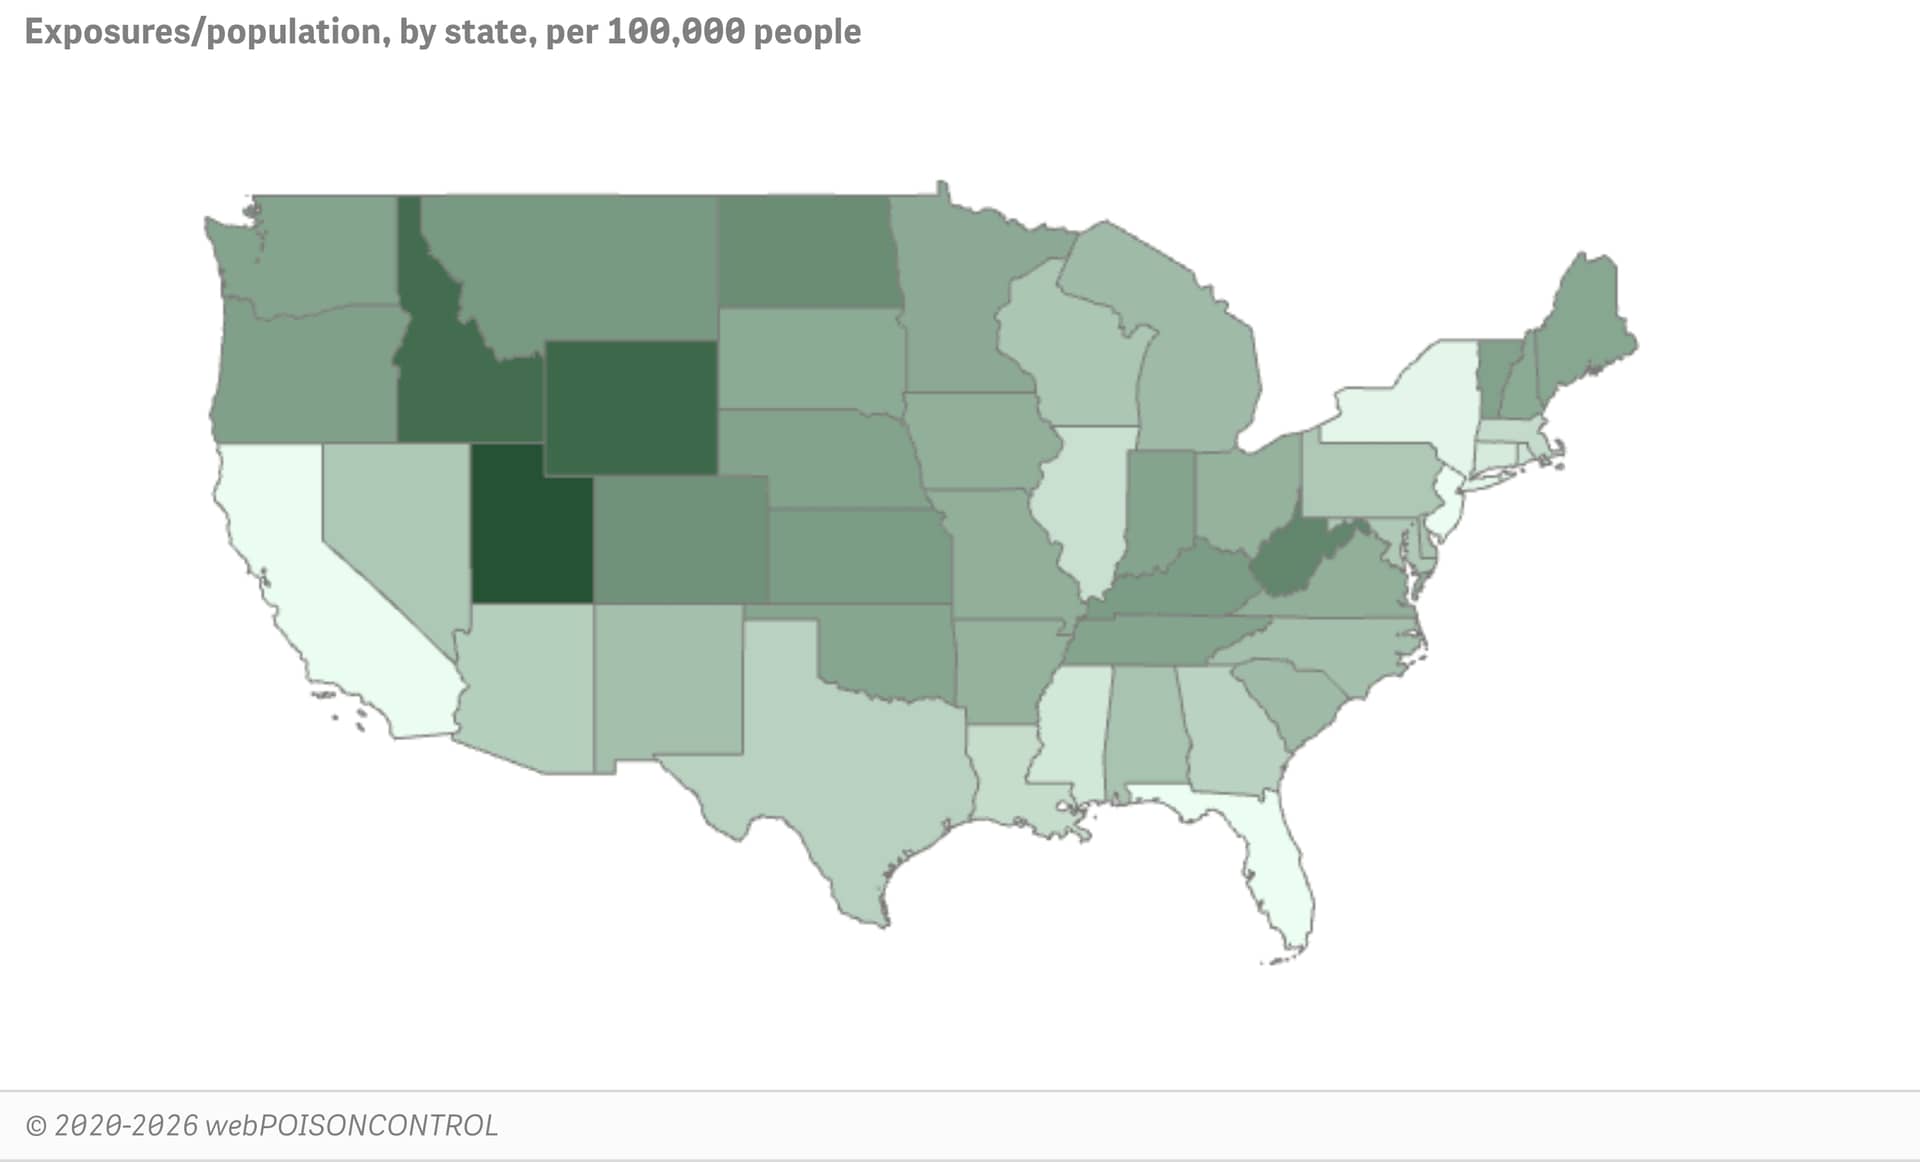
Map of case rates by state
Click to determine the case rate by state (cases/100,000 population) for completed, nonduplicated webPOISONCONTROL cases.
Enlarge the chart and apply filters to the case rate by state for selected age groups, sex, outcomes, routes, month/year, substance categories, triage recommendation or double dose cases.
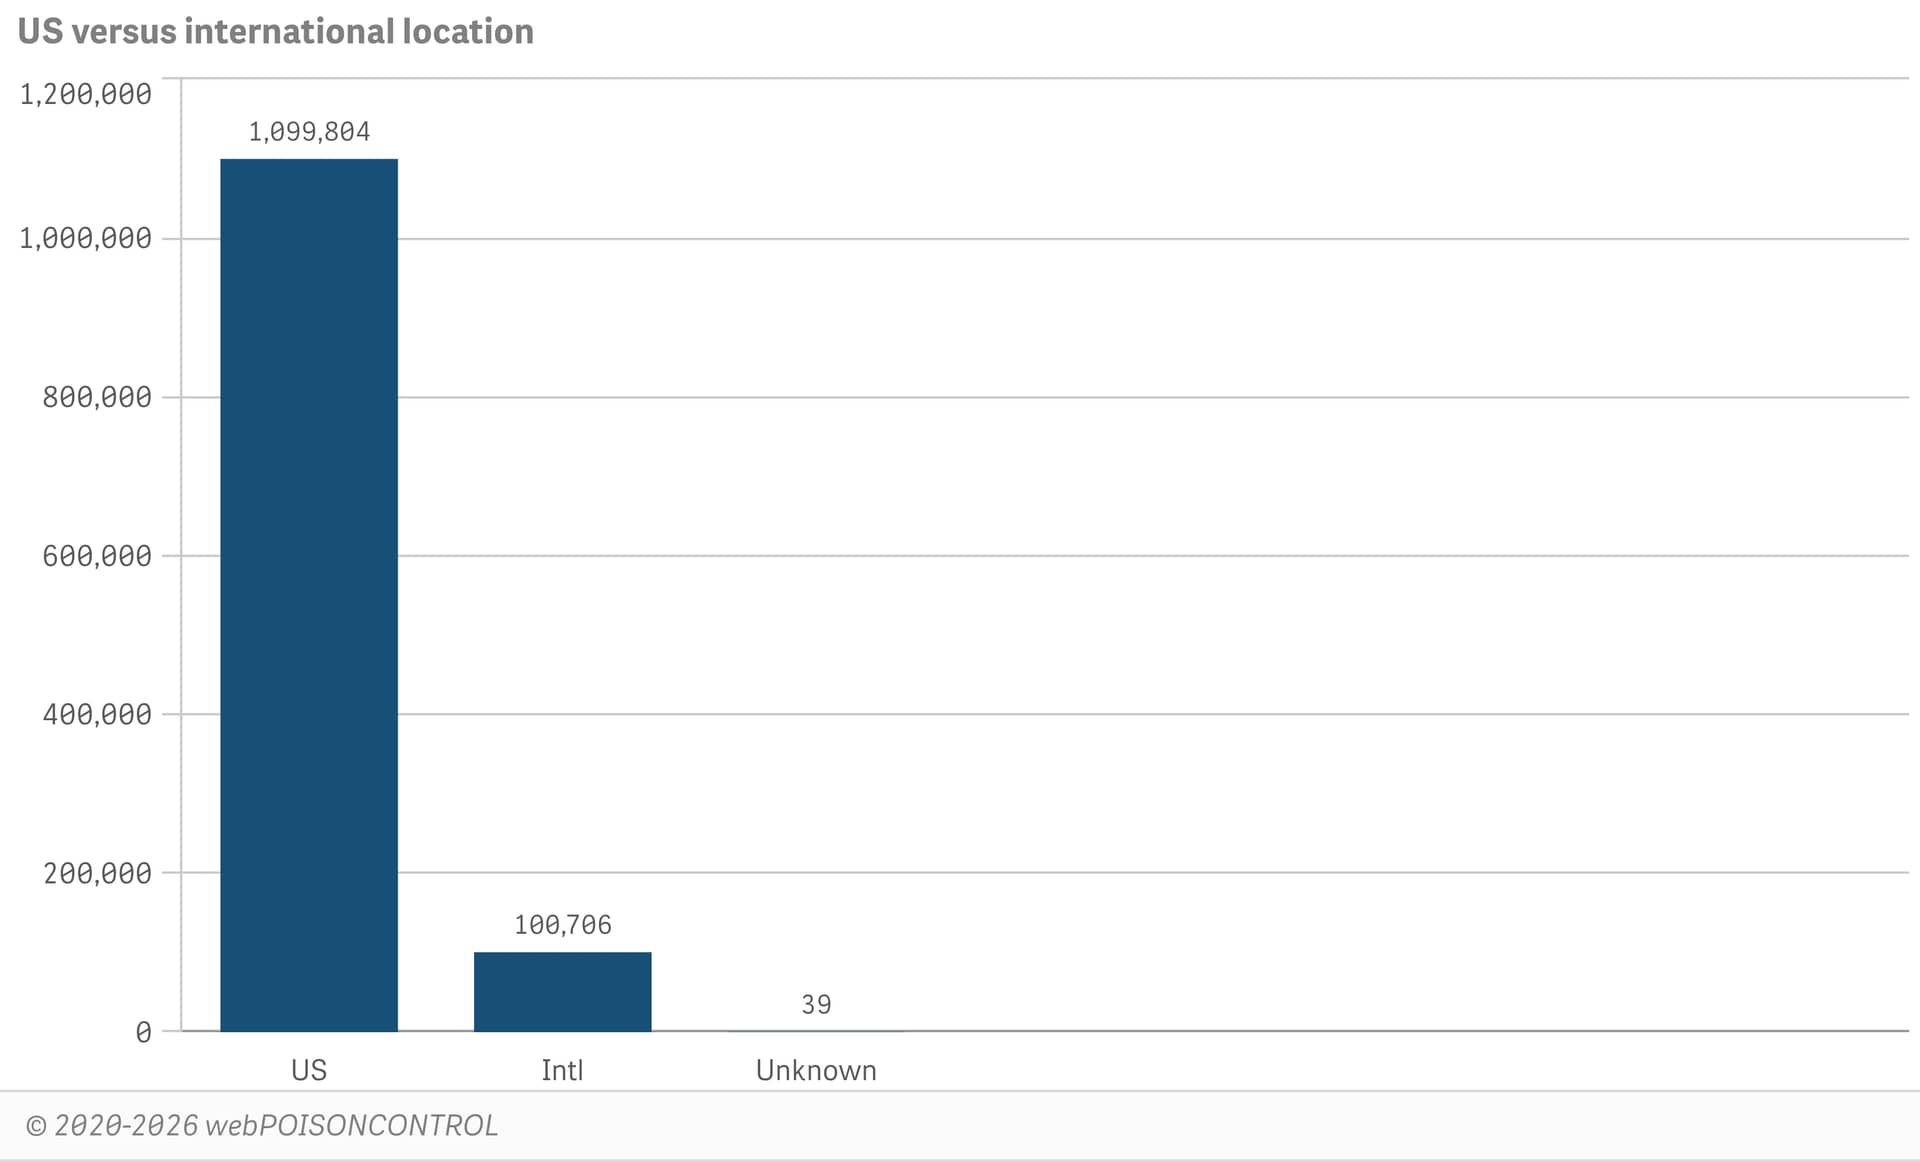
US vs international
Click to determine the international versus US case distribution for completed, nonduplicated webPOISONCONTROL cases.
Enlarge the chart and apply filters to that distribution for selected age groups, sex, outcomes, routes, month/year, substance category, triage recommendation or double dose cases.
Routes
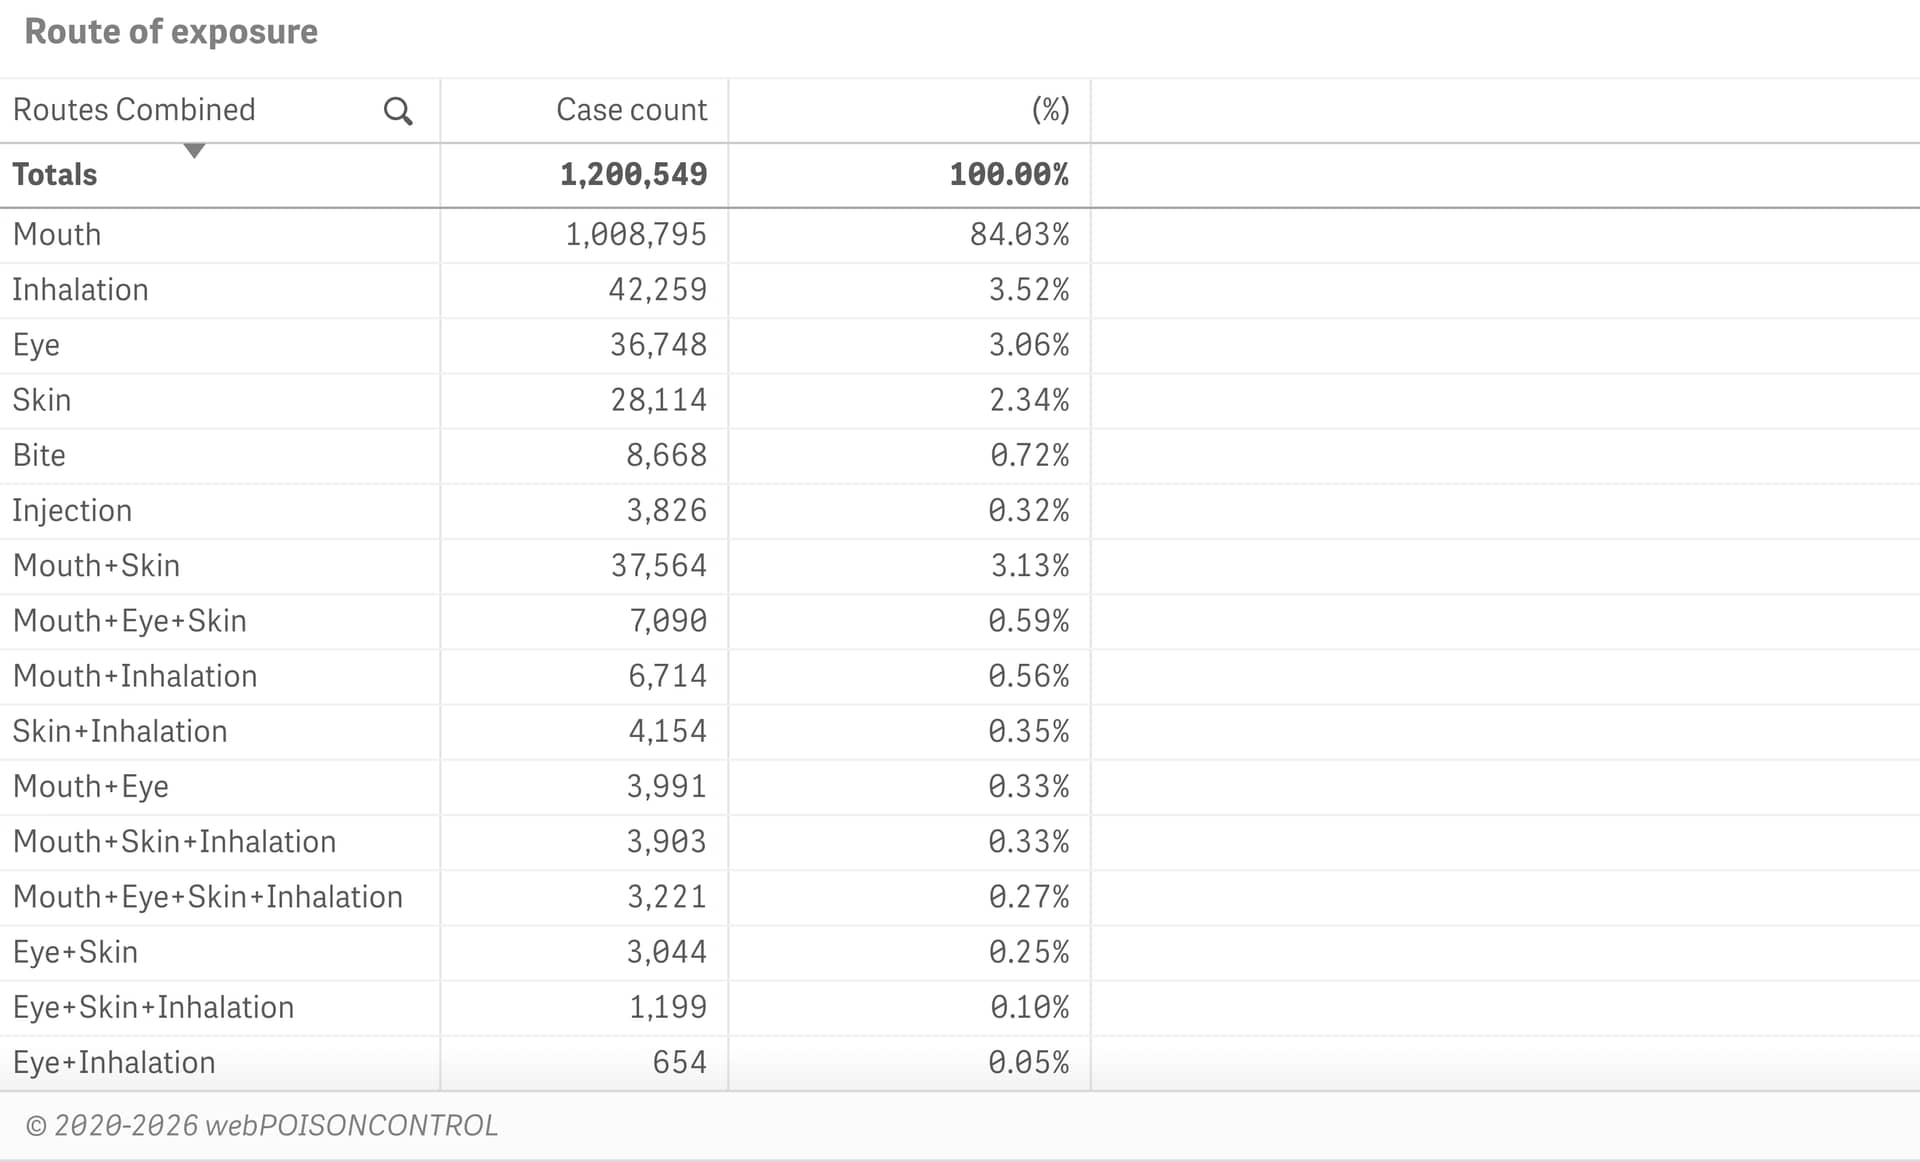
Routes distribution
Click to display a pie chart and a table showing routes and route combinations implicated in poison exposure cases.
Click to enlarge the chart and apply filters to analyze a subset of the data, such as by year, age, or substance category.
Substances
Substance categories by age
Click to see 8 bar charts showing age distribution by substance category.
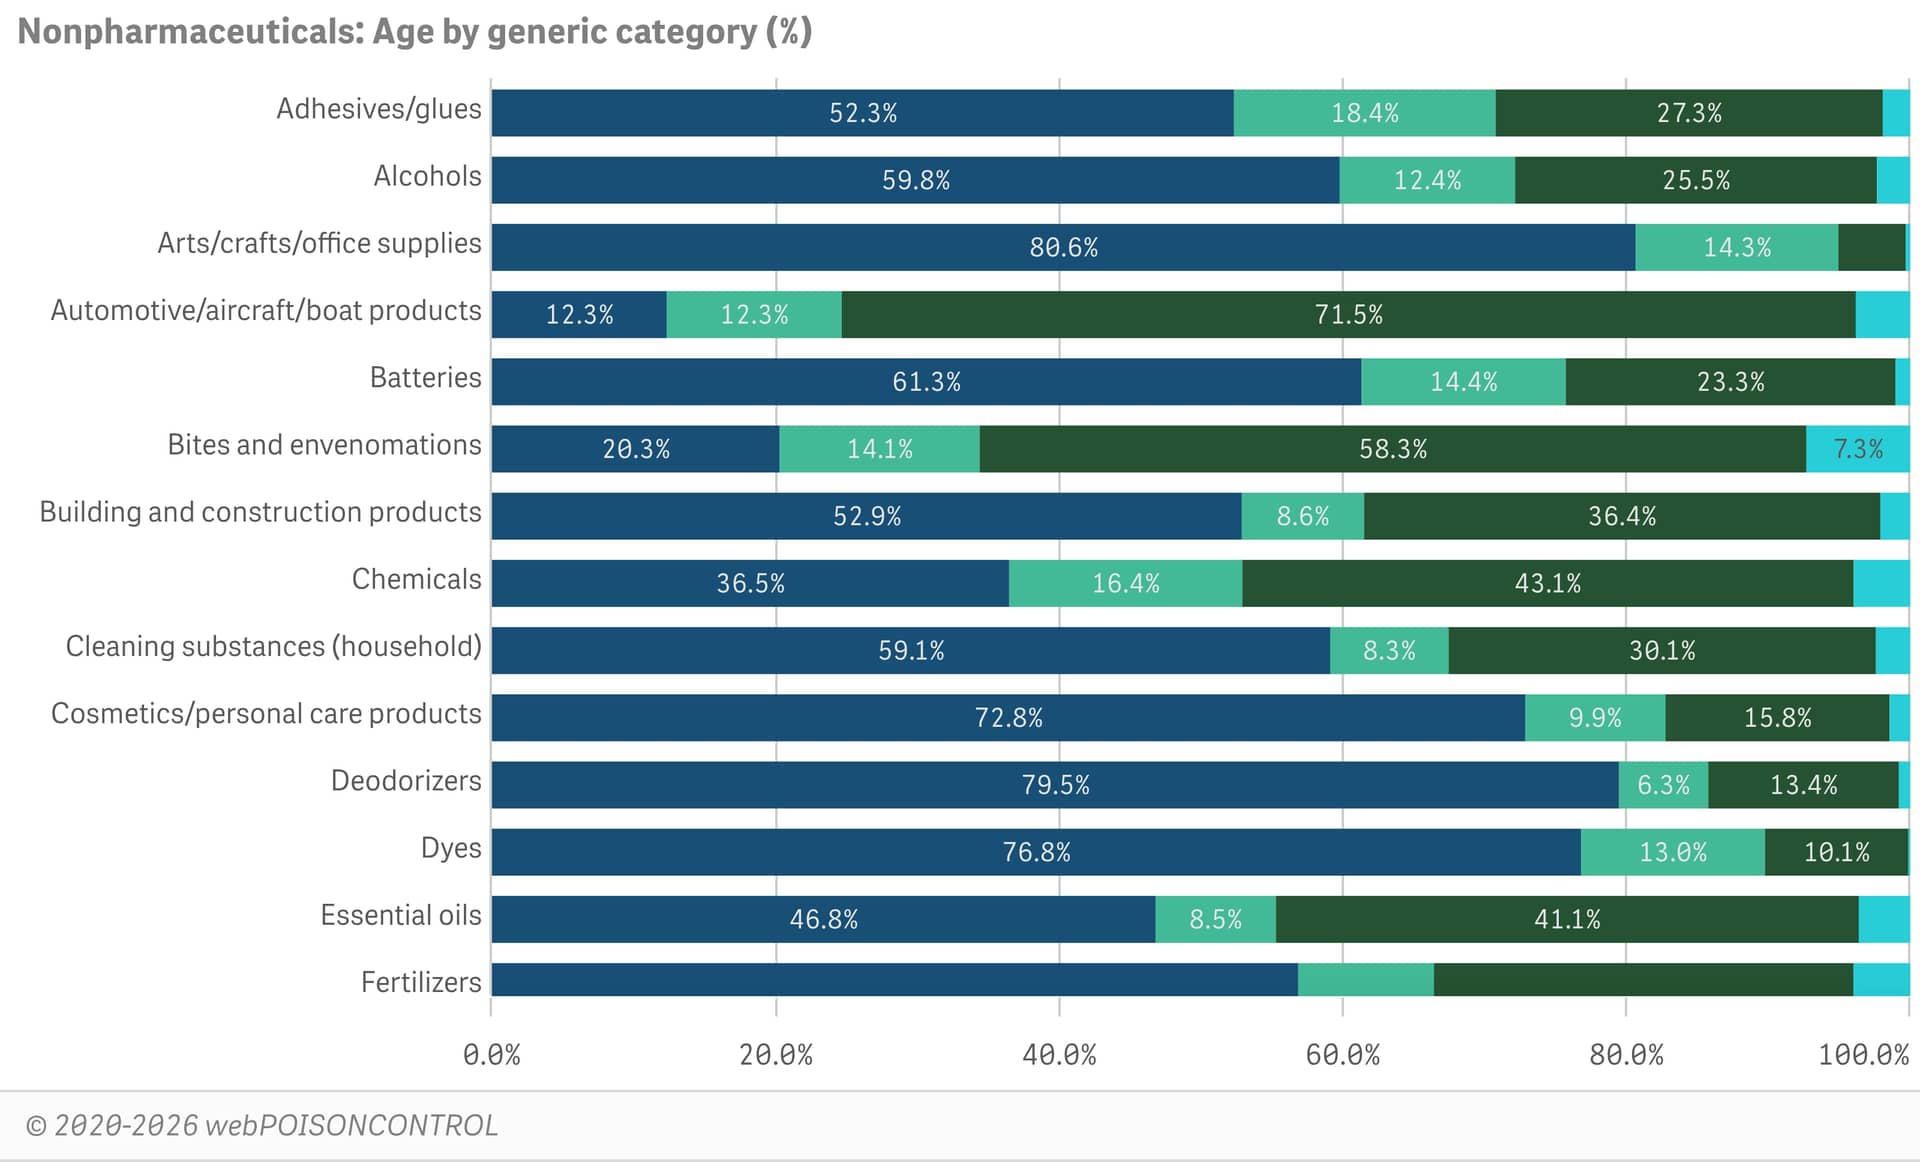
Age by category, nonpharmaceuticals (%)
Age by category, pharmaceuticals (%)
Age distribution, all nonpharmaceuticals compared to all pharmaceuticals (count or %)
Age by category, nonpharmaceuticals, pediatric focus (%)
Age by category, pharmaceuticals, pediatric focus (%)
Age distribution, all nonpharmaceuticals compared to all pharmaceuticals, pediatric focus (count or %)
Enlarge the chart and apply filters to display selected data, such as year, outcome, route, etc.
Substance categories by final triage
Click to see 6 bar charts showing final triage by substance category.
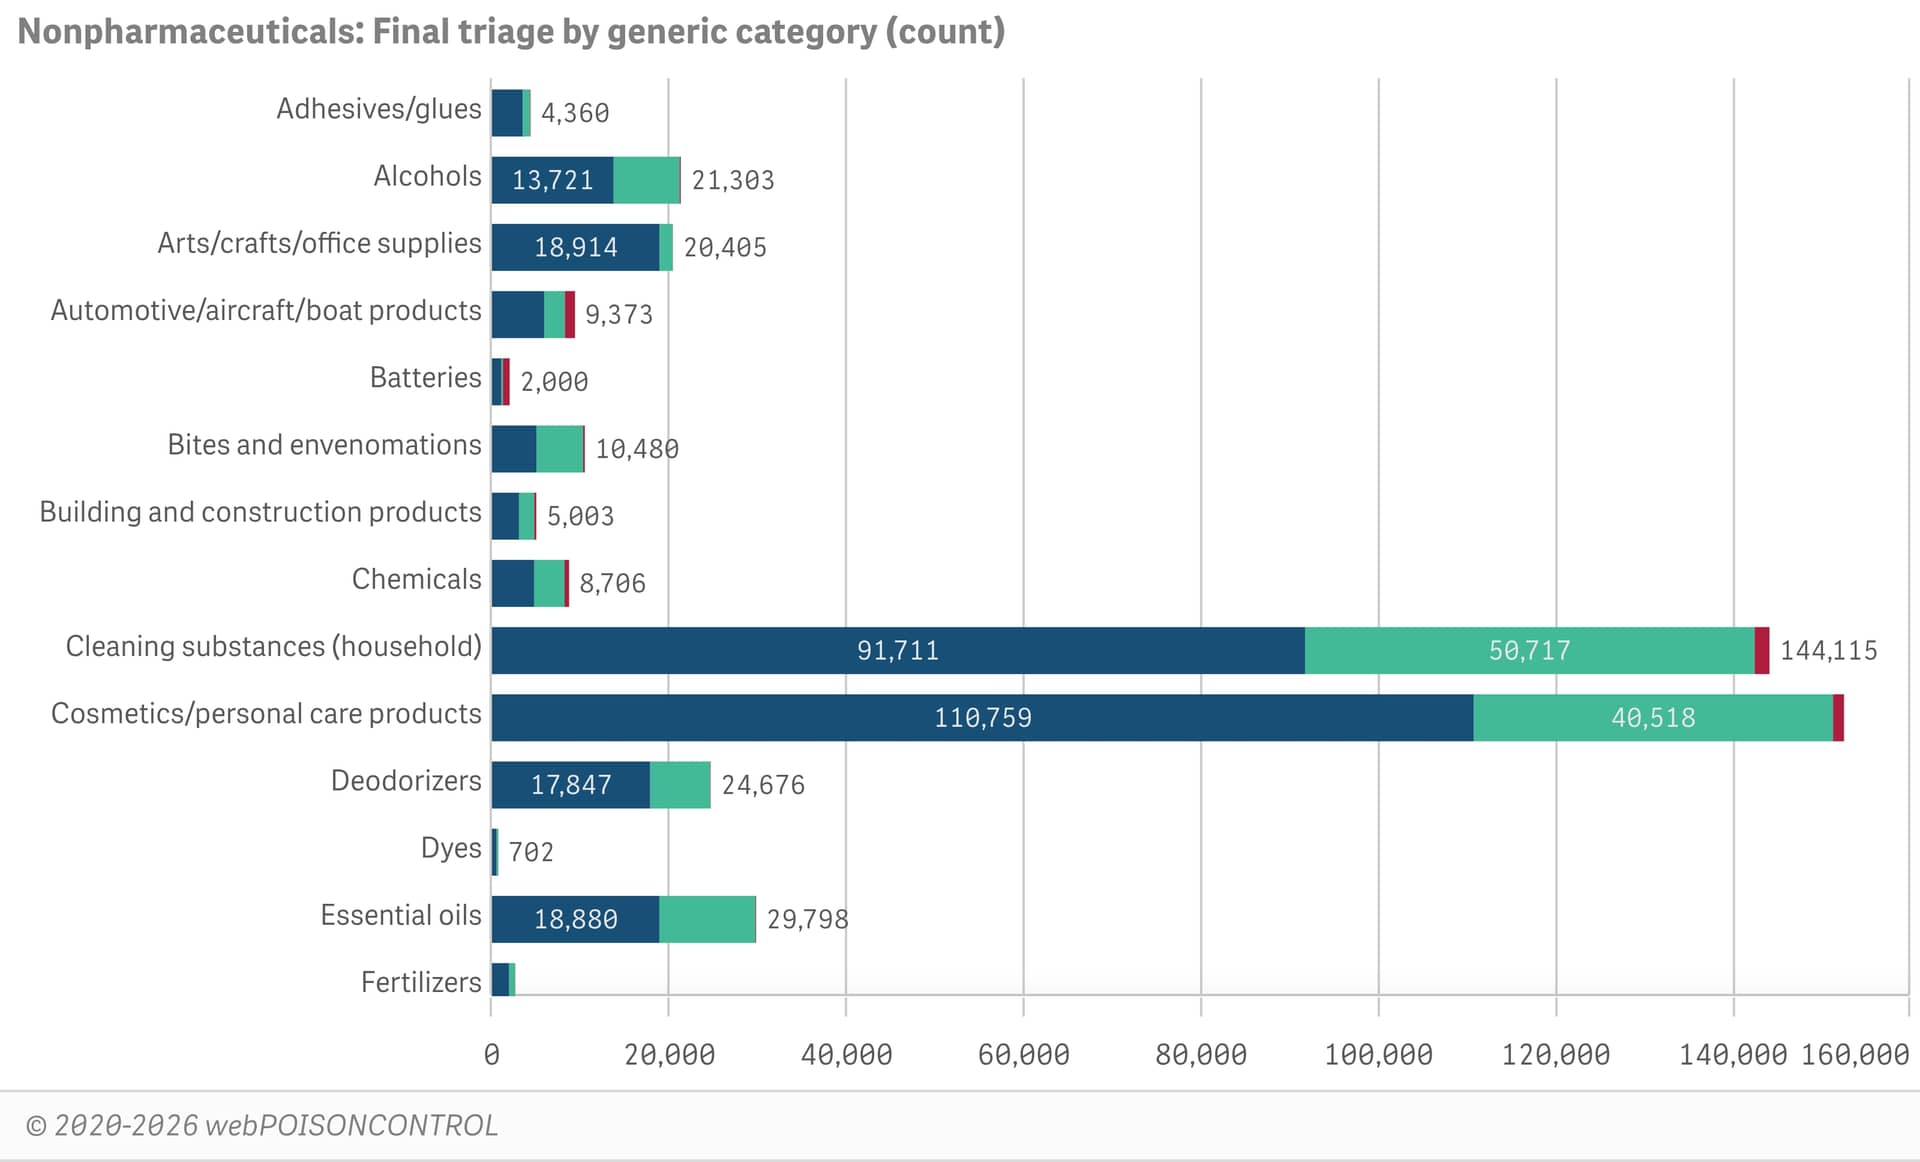
Final triage by category, nonpharmaceuticals (count or %)
Final triage by category, pharmaceuticals (count or %)
Final triage, all nonpharmaceuticals compared to all pharmaceuticals (count or %)
Enlarge the chart and apply filters to display selected data, such as year, age, outcome, route, etc.
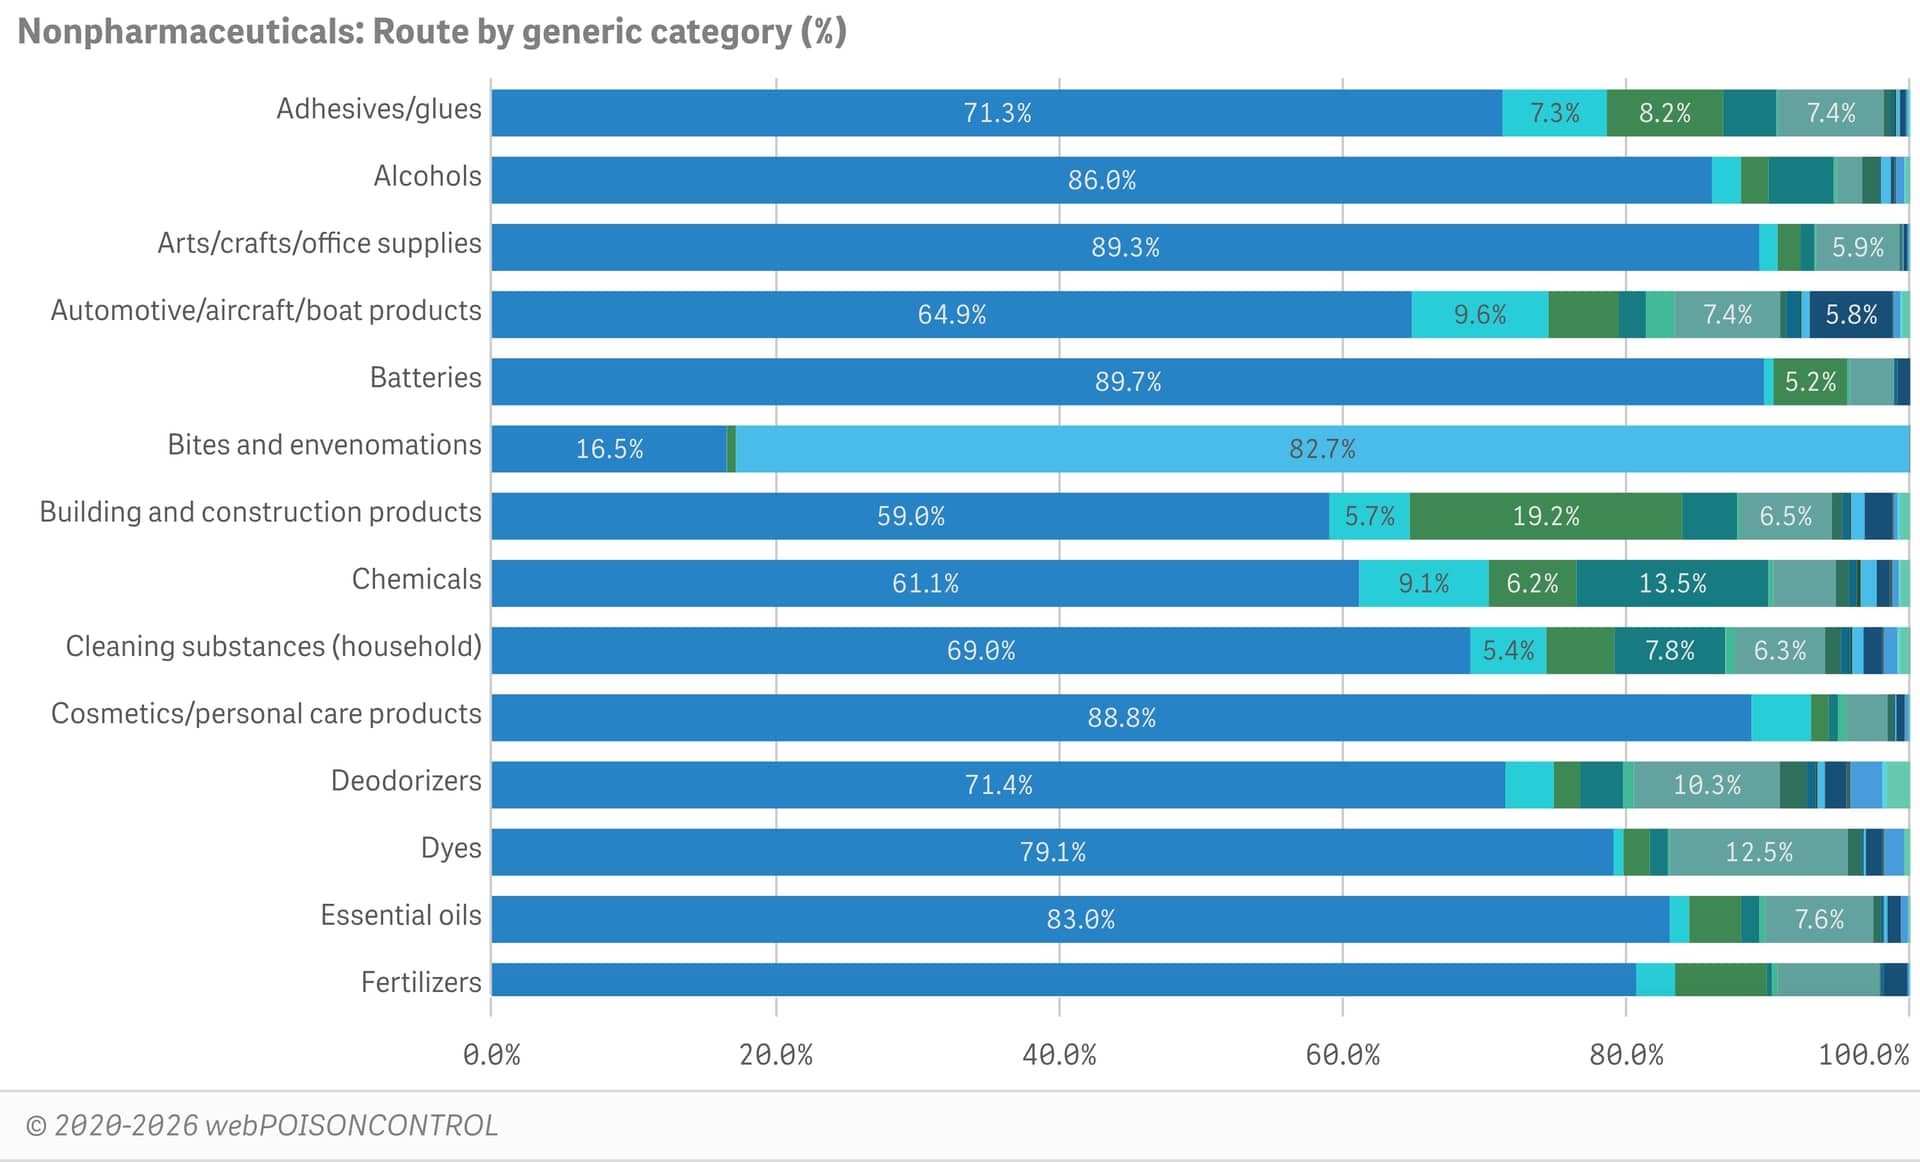
Substance categories by route
Click to see 2 bar charts showing substance categories by exposure route.
Route by category, nonpharmaceuticals (%)
Route by category, pharmaceuticals (%)
Enlarge the chart and apply filters to display selected data, such as year, age, sex, outcome, etc.
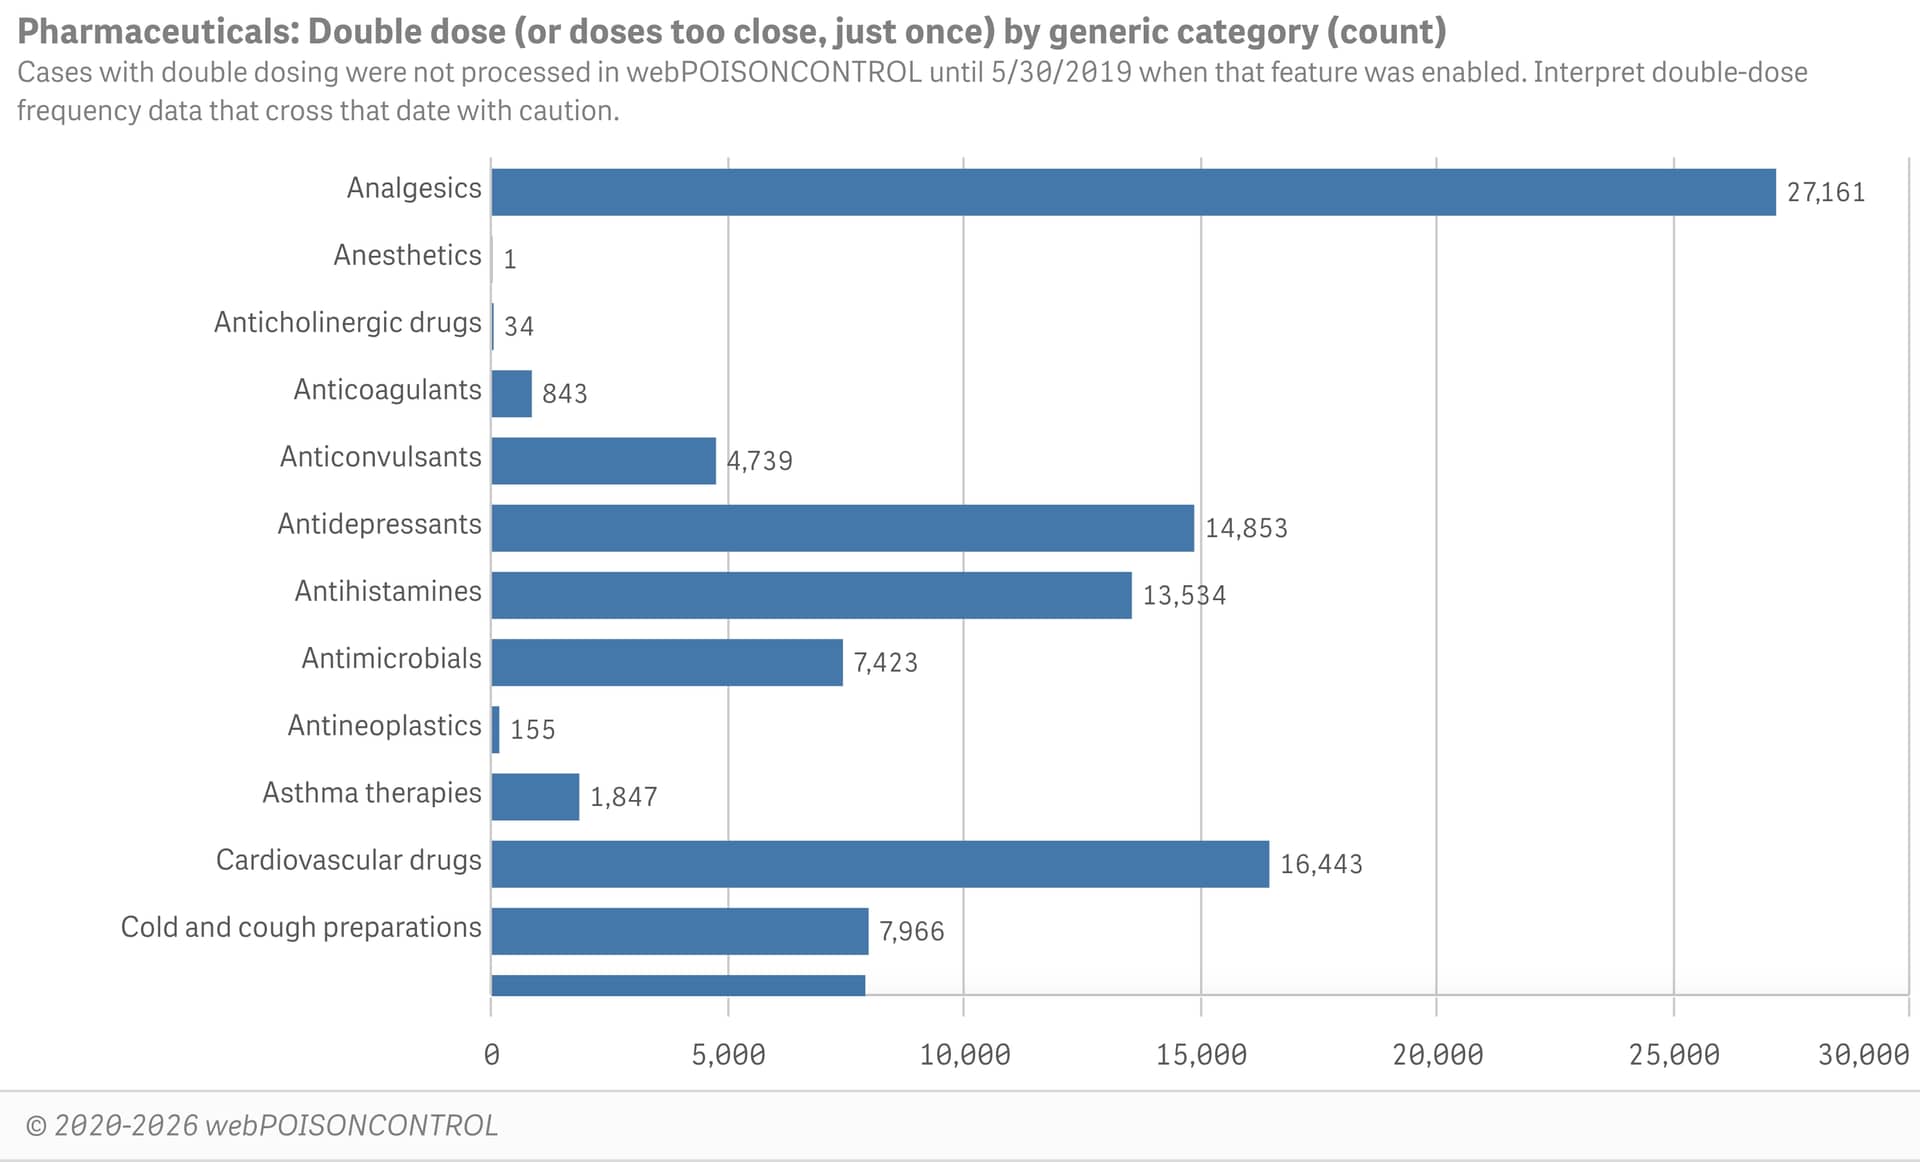
Substance categories for double-dose errors
Click to see 2 bar charts showing double-dose therapeutic errors by pharmaceutical category.
Double dose by pharmaceutical category (count or %)
Apply filters to display selected data, such as year, age, sex, triage recommendation, outcome, etc.
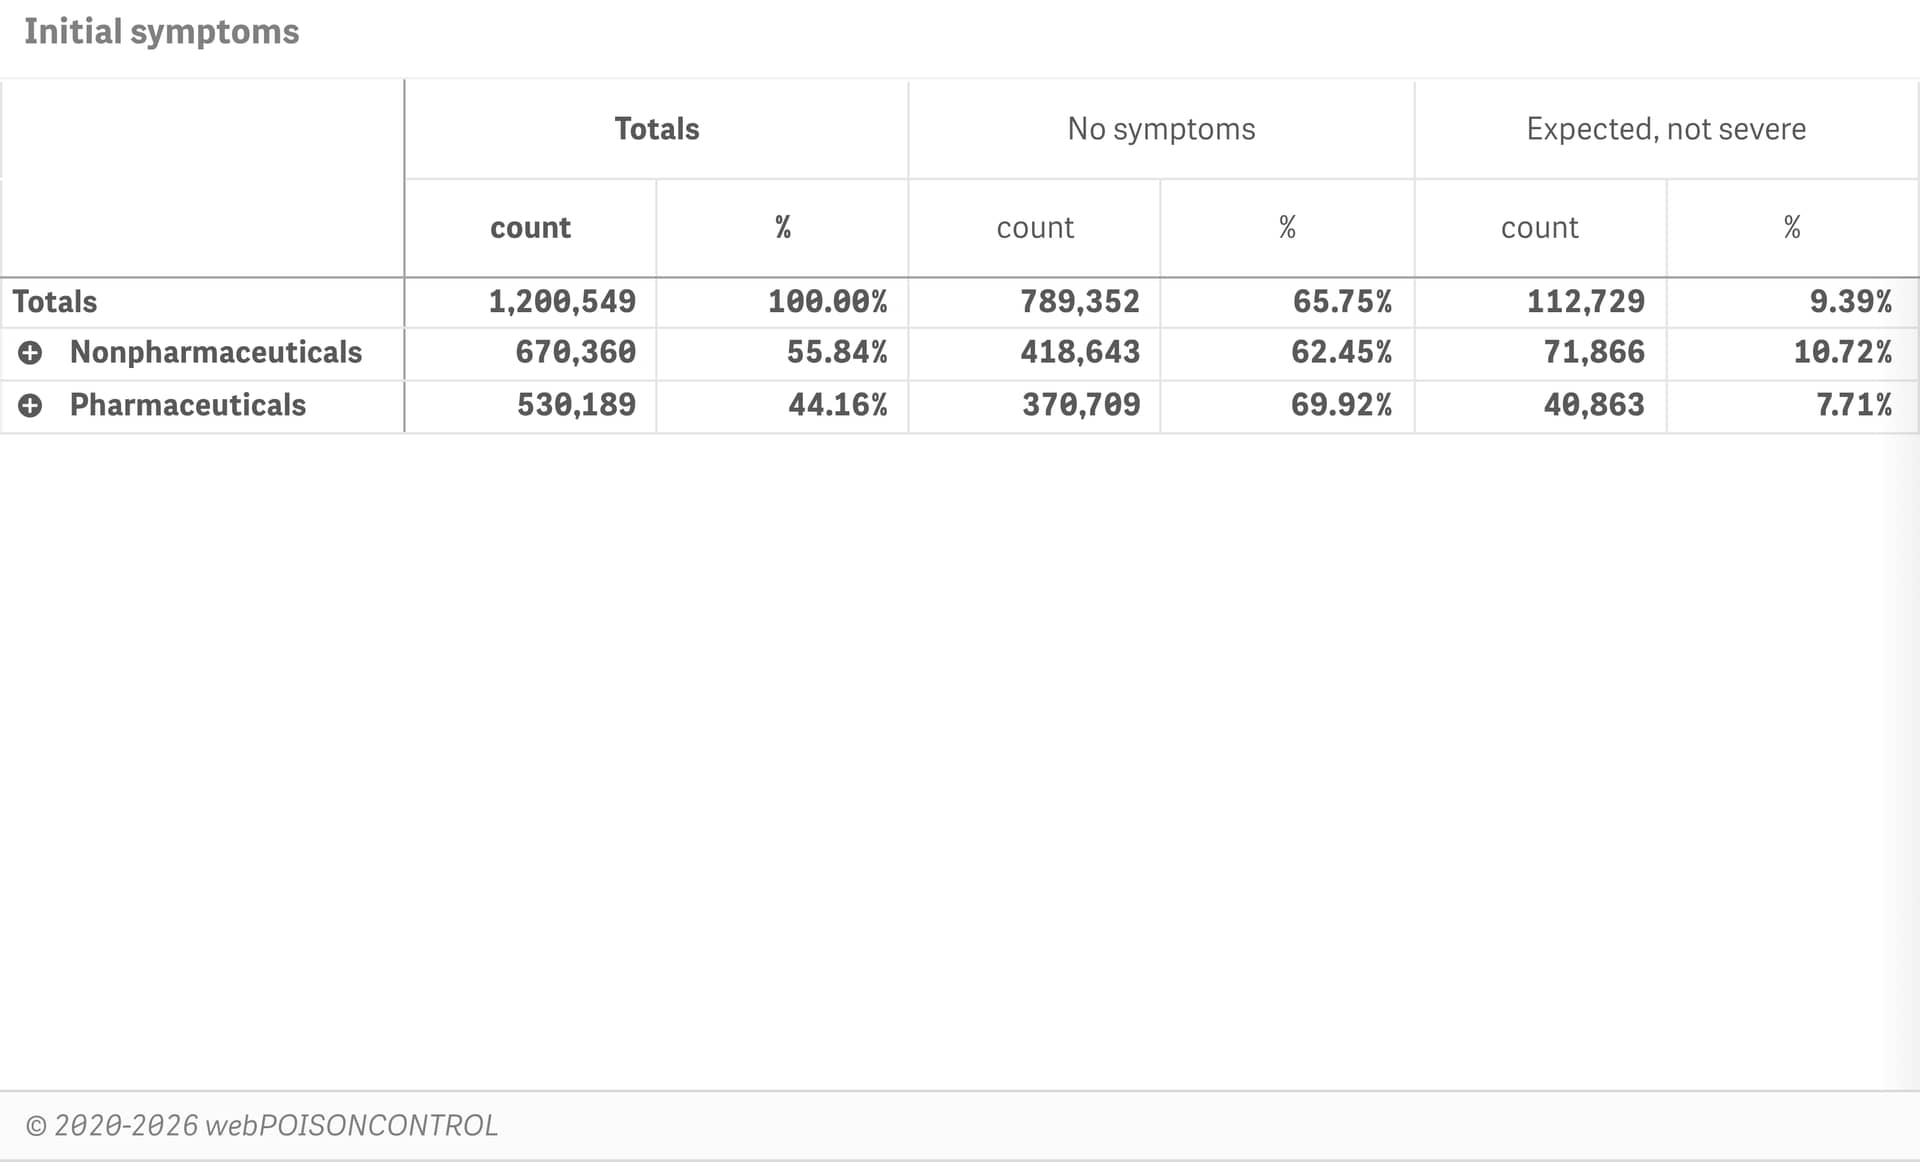
Generic substances and categories by symptoms, triage, outcome, age or double dose
Click to see 5 hierarchical tables, showing Substance Categories, Subcategories, and Generic Substances. Tables present data analyzed by:
Initial symptoms
Final triage
Final outcome
Age distribution
Double dose
Apply filters to display selected data, such as year, age, sex, triage recommendation, outcome, etc.
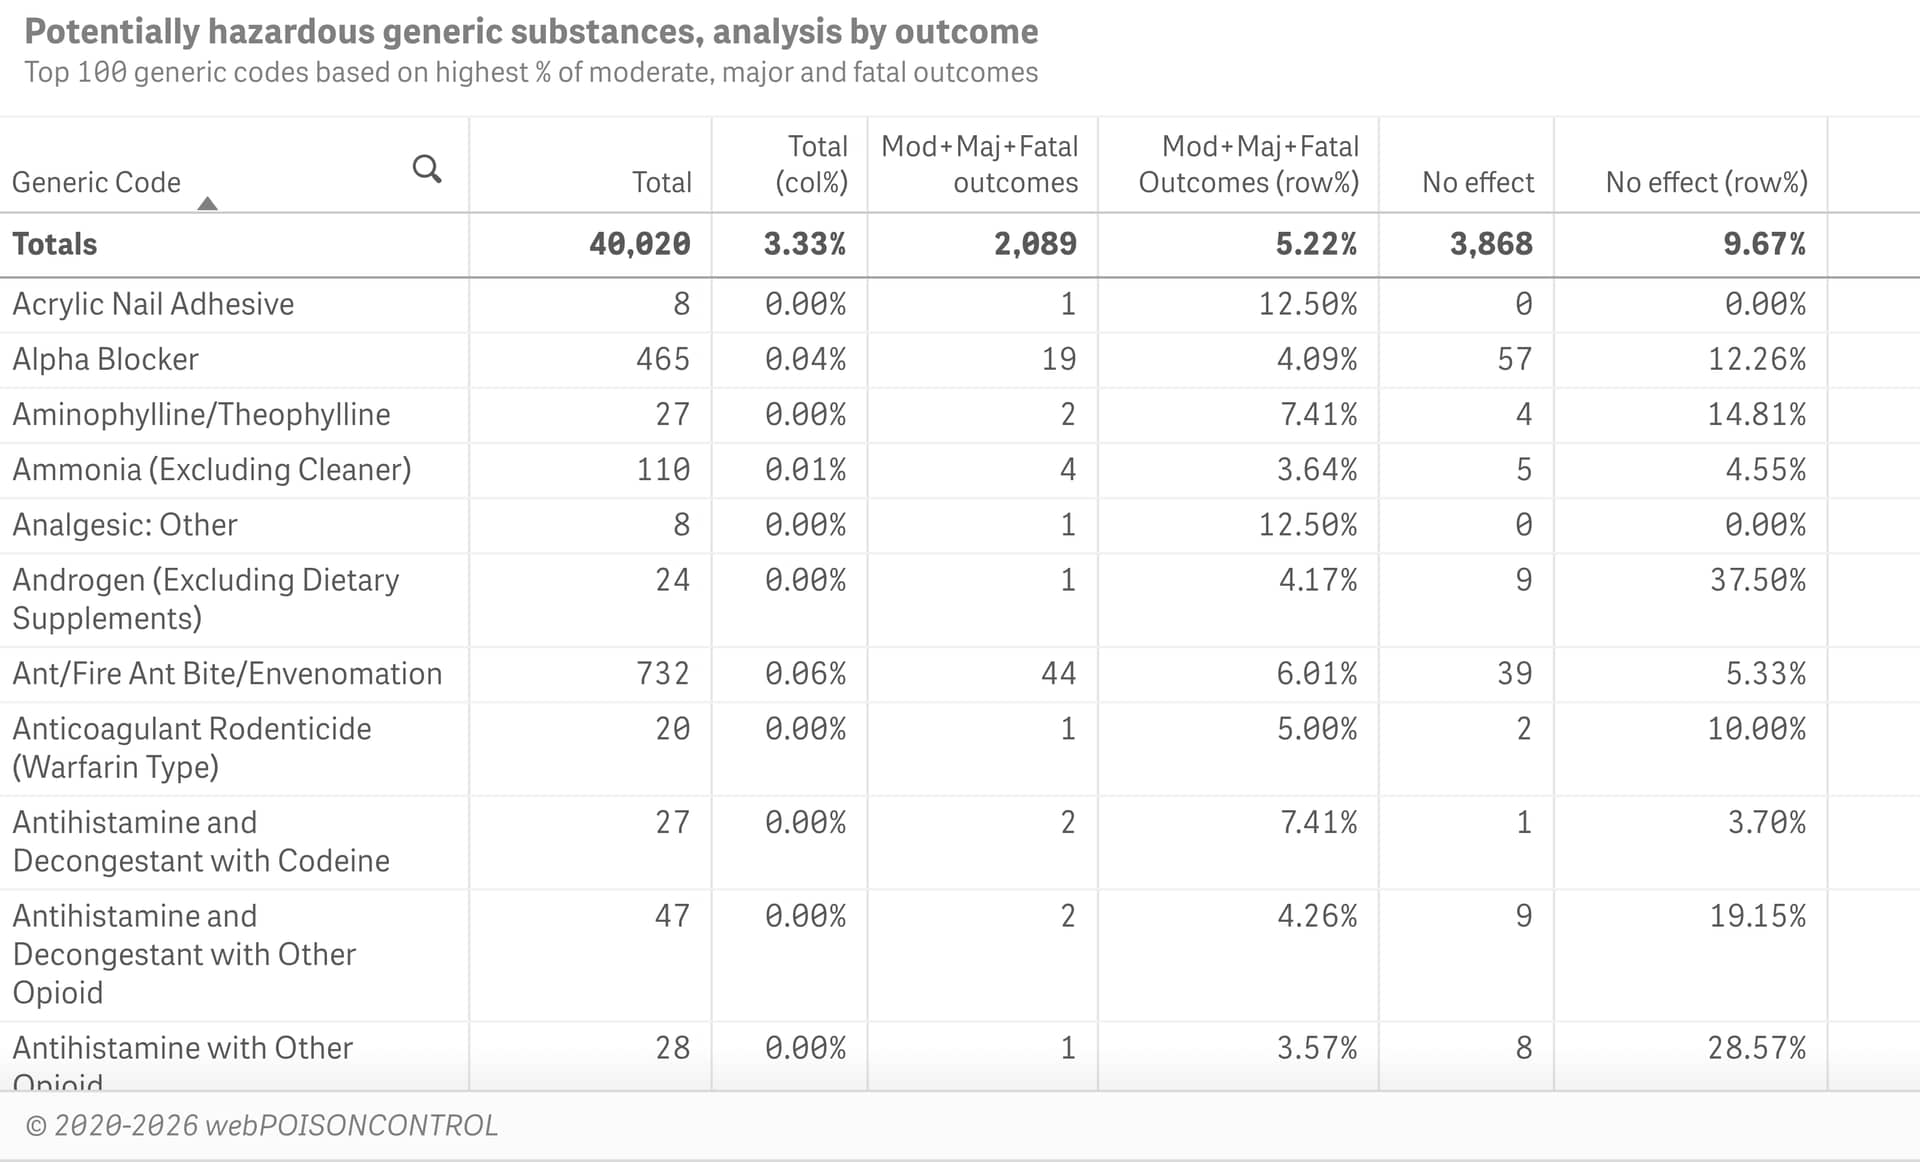
Hazard assessment for generic substances
Click to see a table showing the top 100 generic substances sorted by highest % of moderate, major and fatal outcomes.
Sort by total counts or outcome columns to better understand the results. Note that high rates of severe outcomes are less meaningful when case counts are very low.
Apply filters to display selected data, such as year, age, sex, pharmaceuticals versus nonpharmaceuticals, etc.
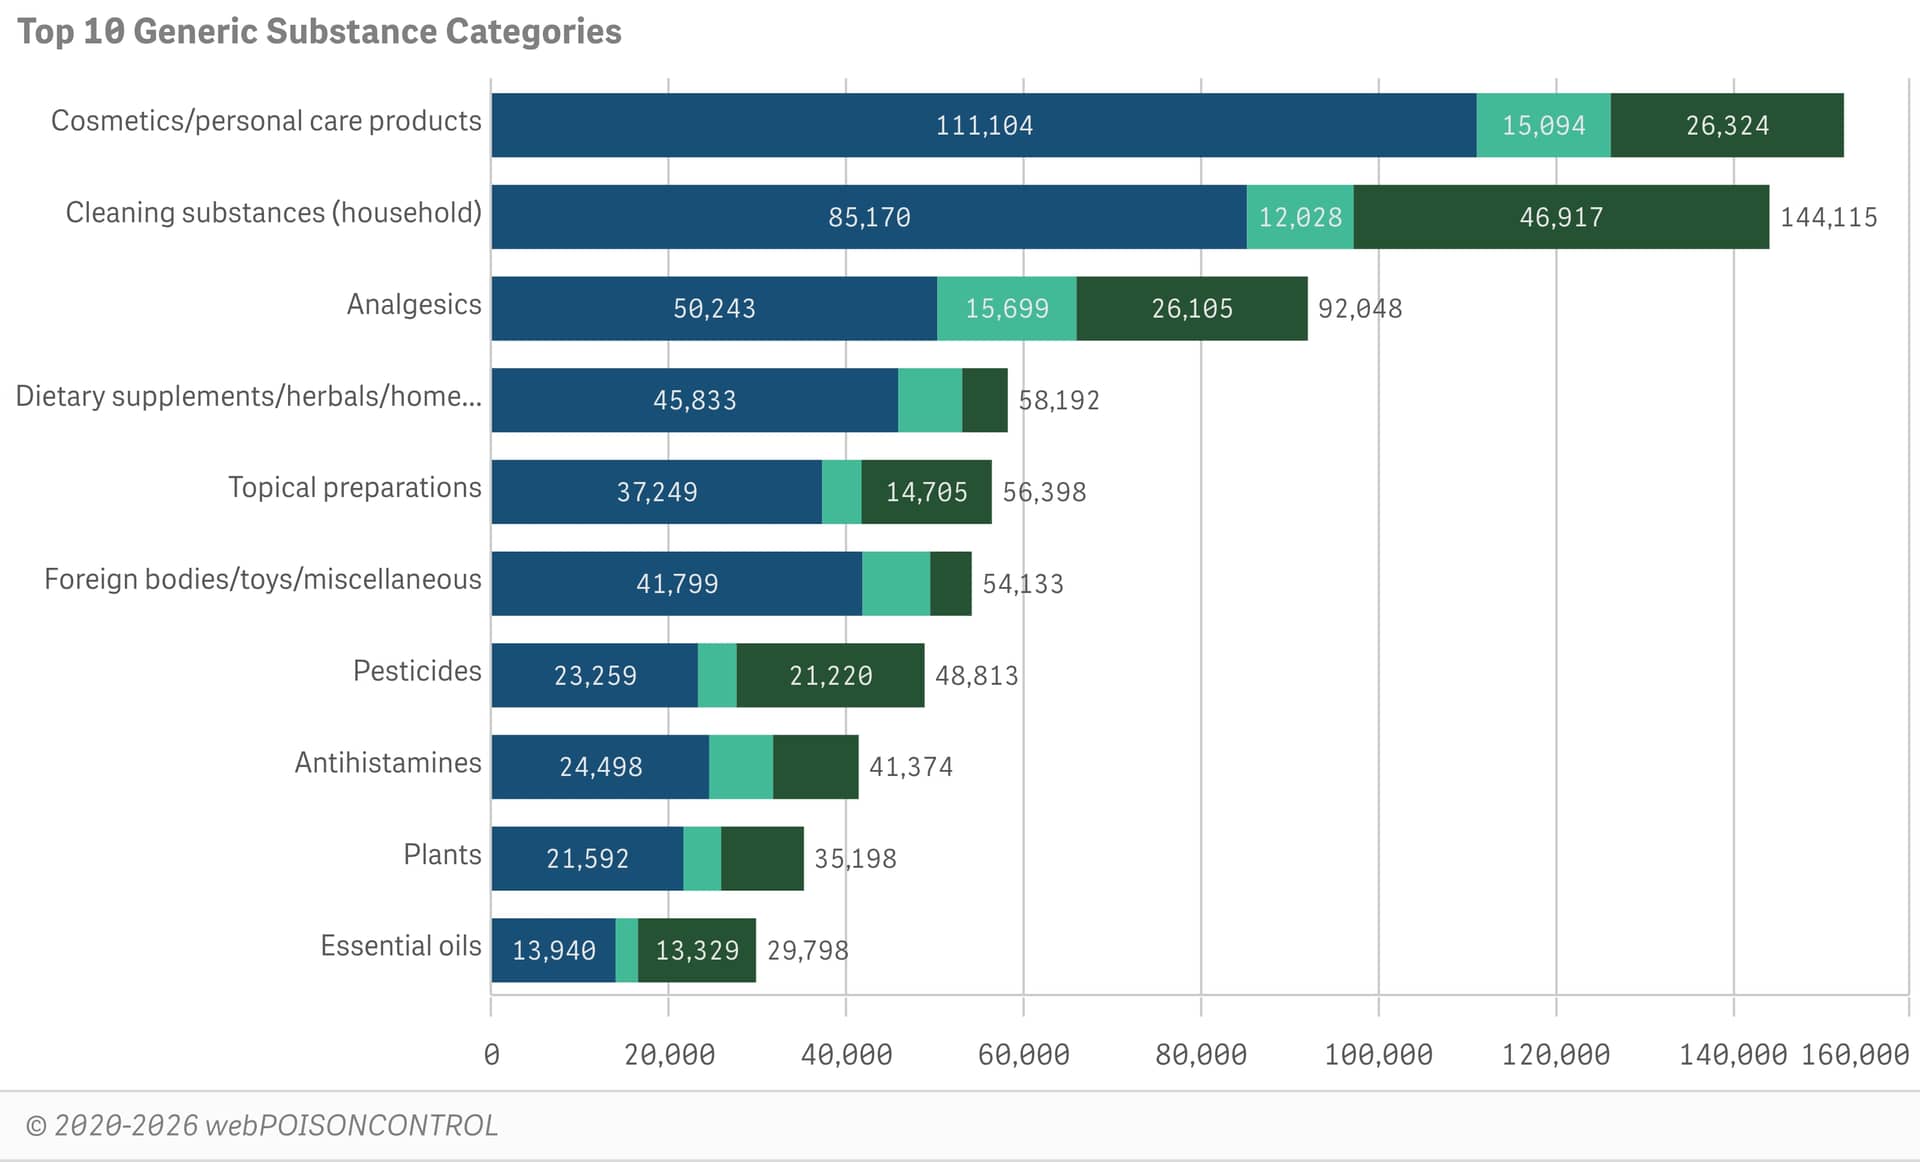
Top 10 and top 10 for kids (<6 years)
Click to see 2 bar charts.
The top 10. Shows the 10 most frequent substance categories, with the age distribution for cases in these categories.
The top 10 in Kids. Shows the 10 most frequent substance categories in children younger than 6 years.
Apply filters to display selected data such as year, sex, route, etc.
Symptoms
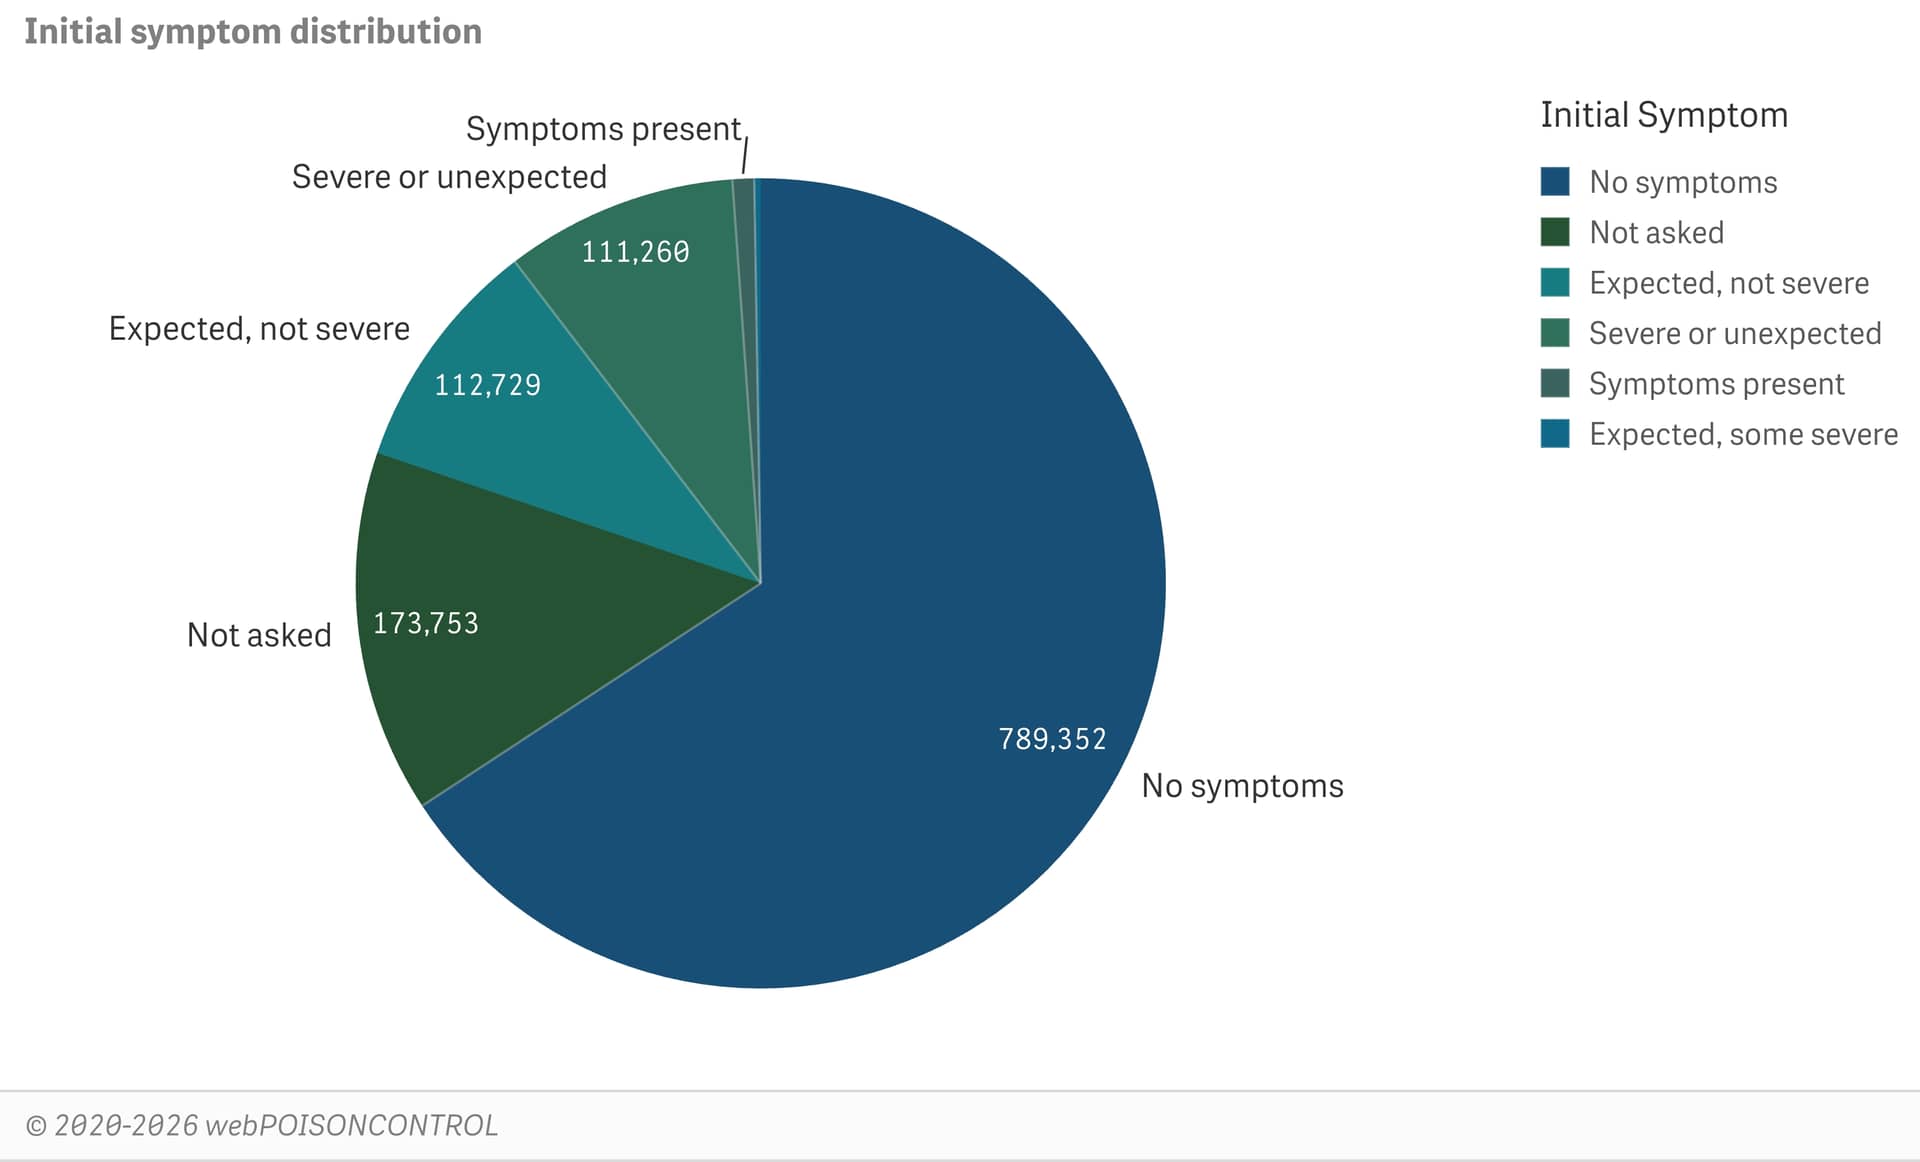
Initial symptom distribution
Click to display a pie chart showing initial symptom distribution for poison exposure cases.
Apply filters to analyze data by year, age, substance category, route, etc.
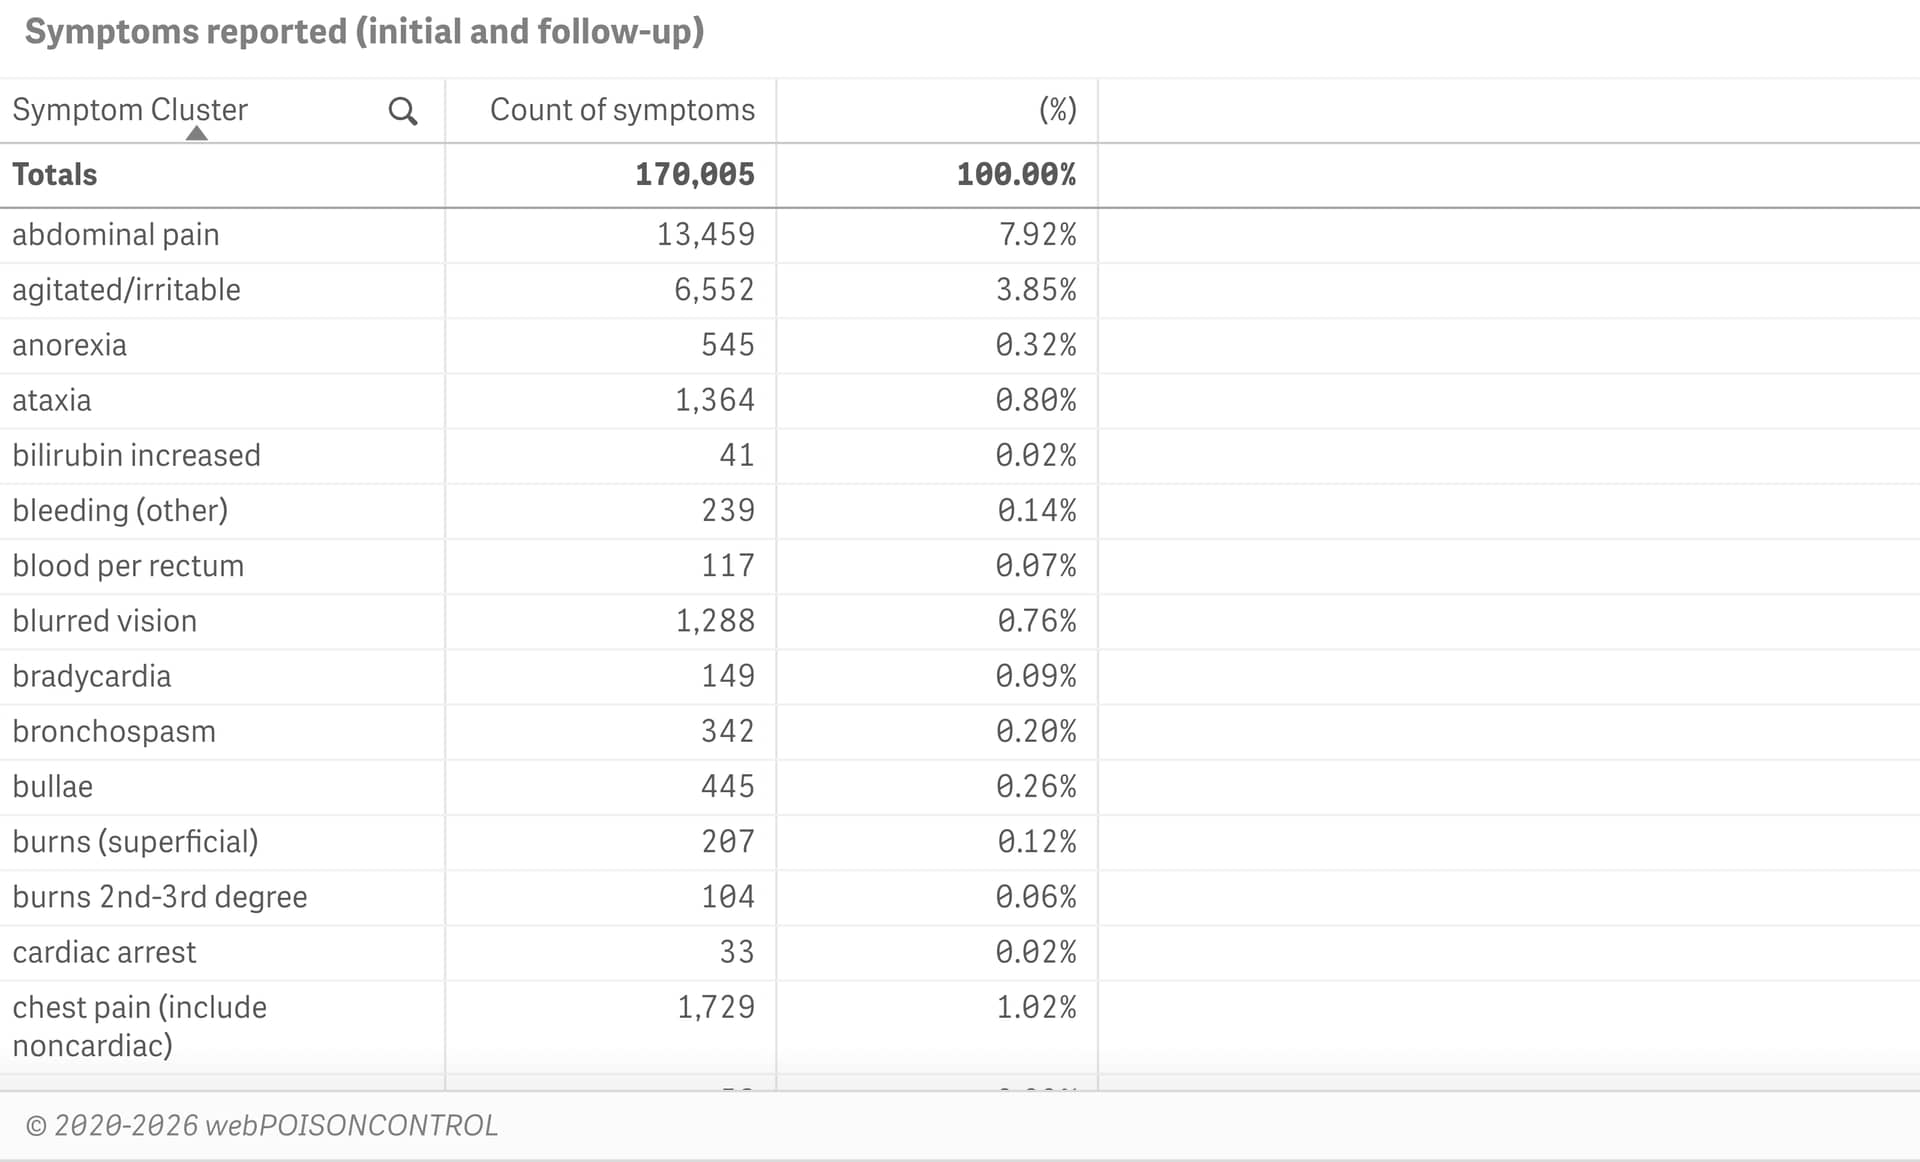
Specific symptoms (initial and follow-up)
Click to show a table of specific clinical effects reported during triage or follow-up.
Apply filters to analyze data by year, age, substance category, route, etc.
Trending
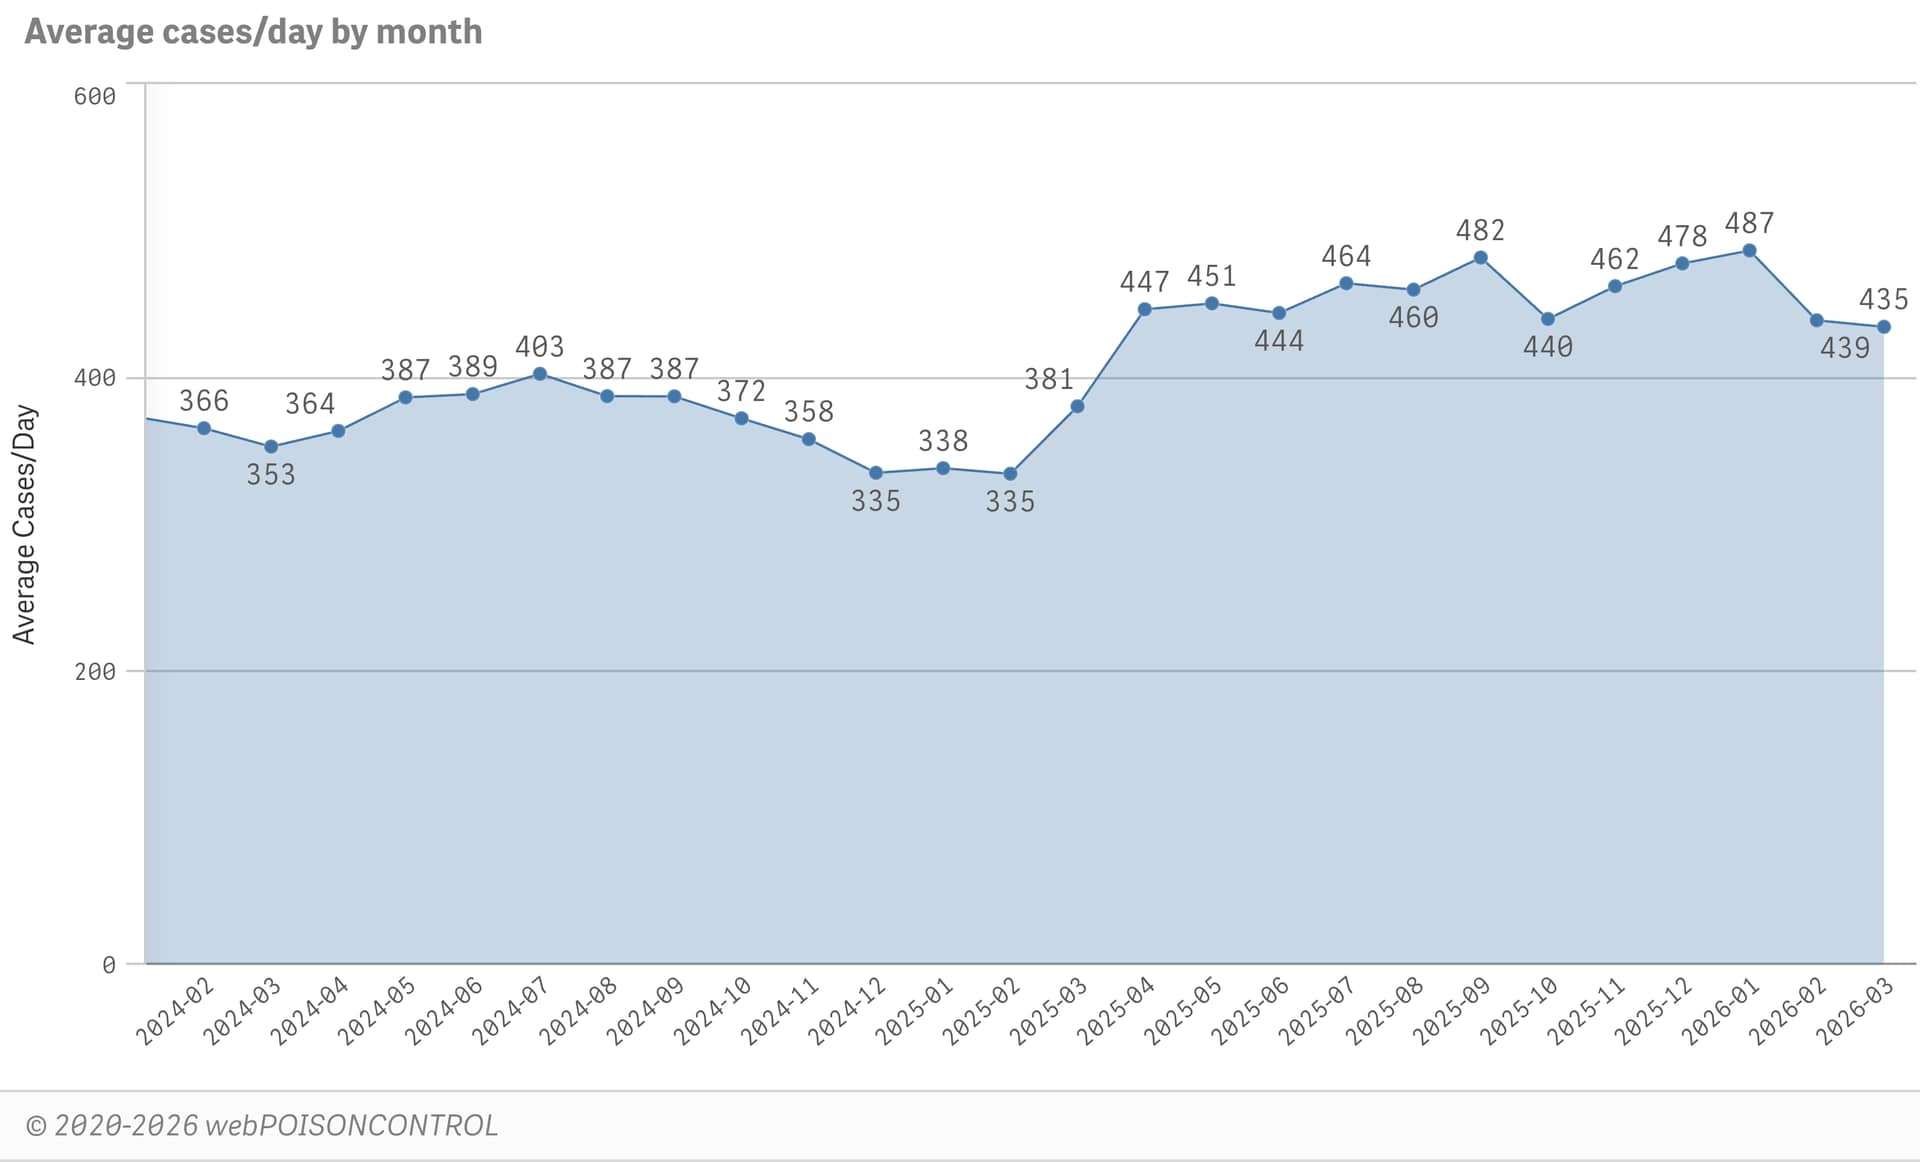
Average cases/day by month
Shows average daily count for completed, nonduplicated webPOISONCONTROL cases, by month, for trending.
Click to enlarge the chart and apply filters to show trends by substance category, age, route, triage recommendation, outcome, etc.
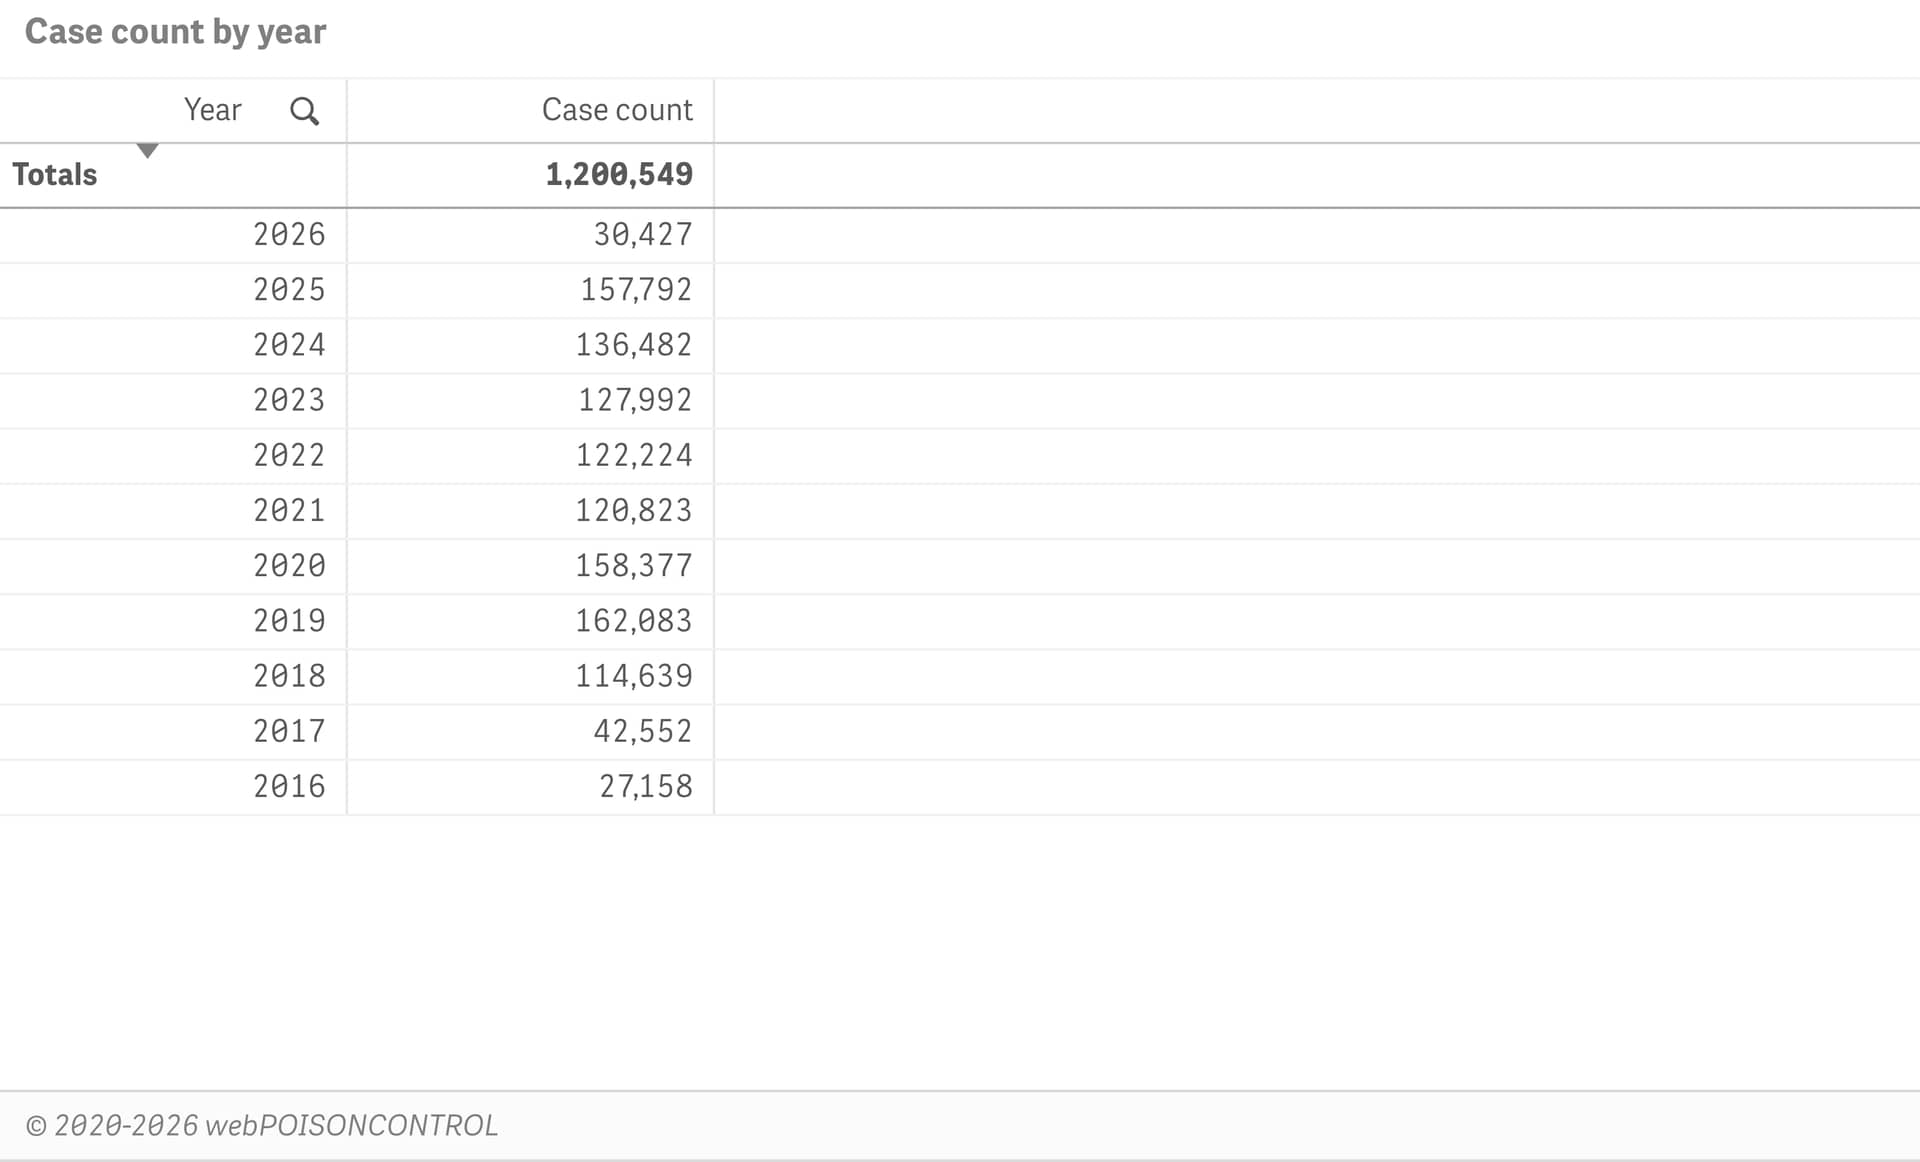
Case count by year
webPOISONCONTROL completed public cases are shown, by year, and updated daily. Duplicate cases are excluded. Test cases are excluded.
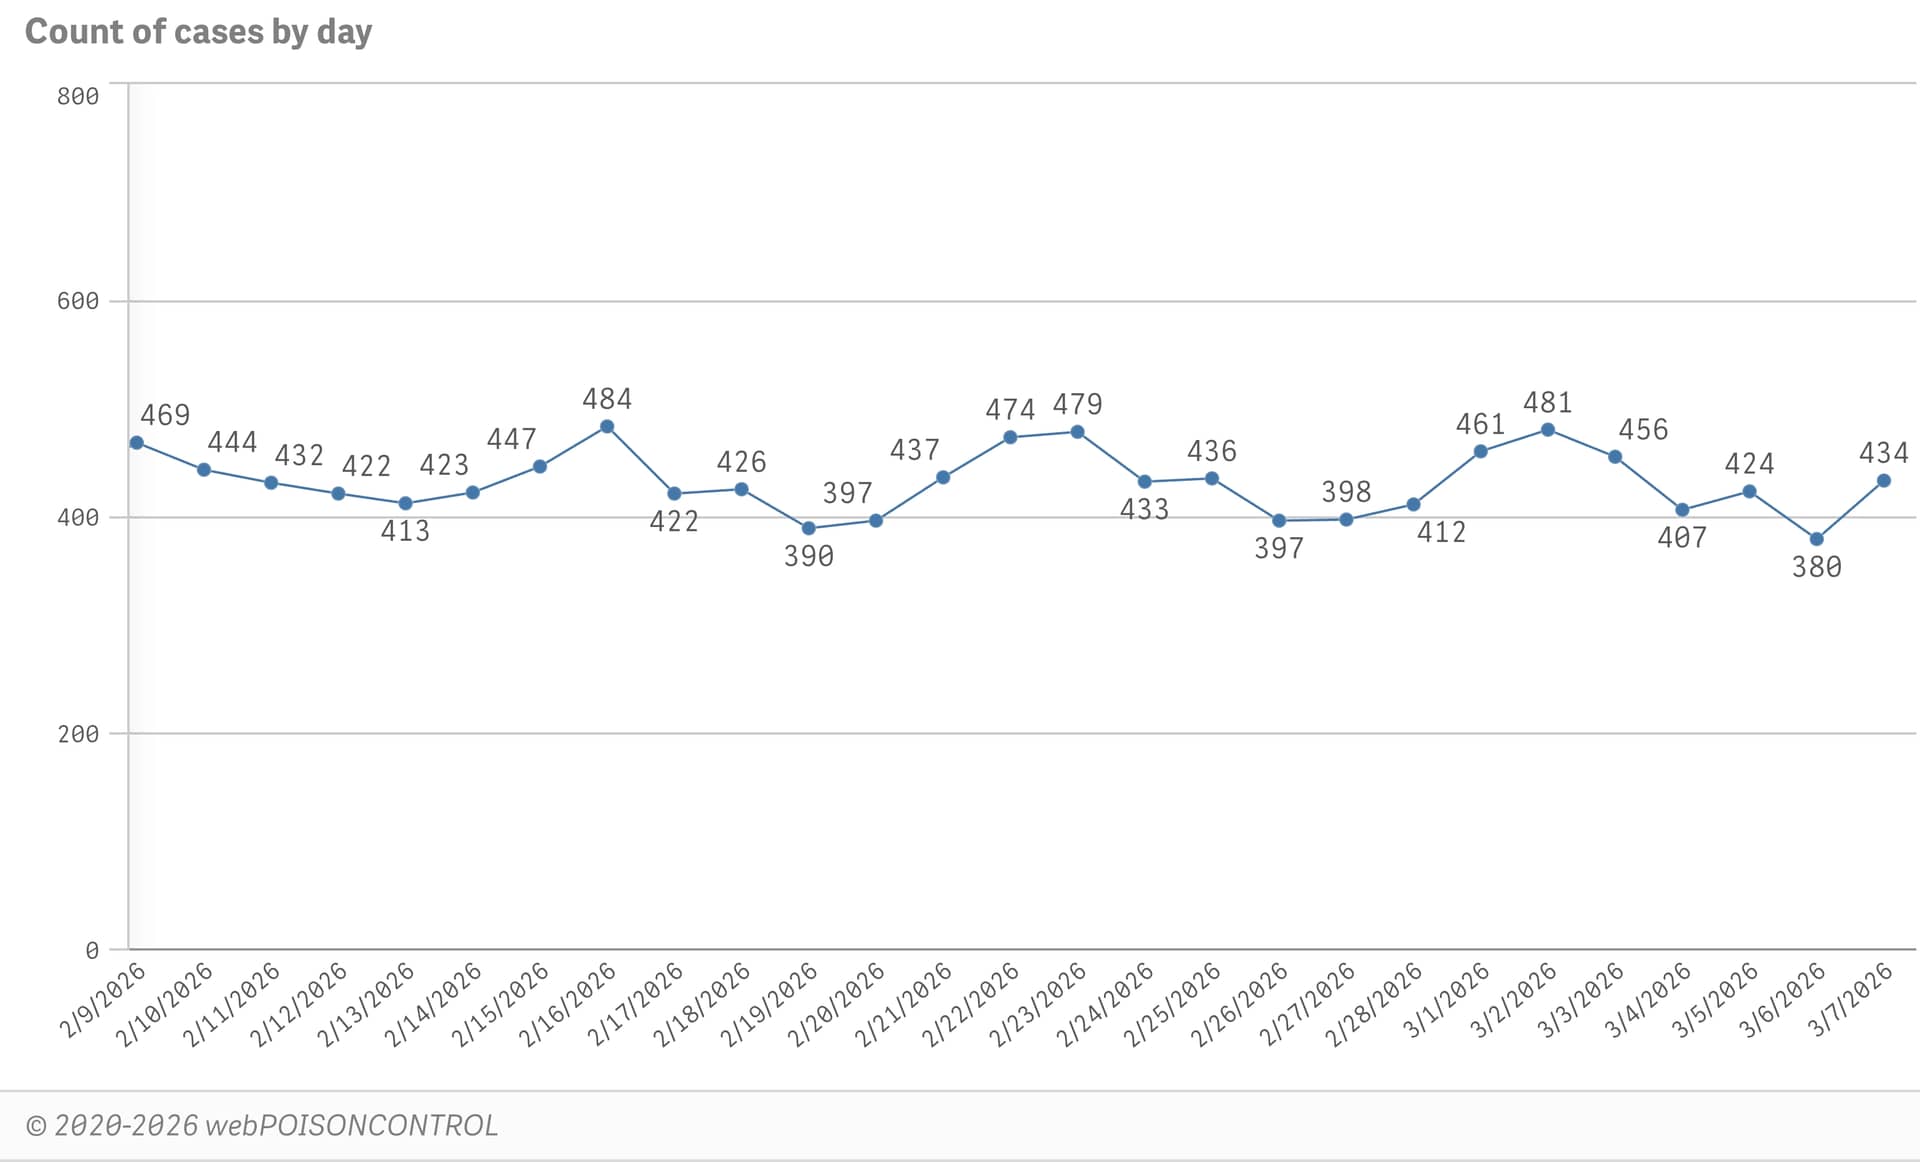
Cases by day
Shows daily case count for completed, nonduplicated webPOISONCONTROL cases, for trending.
Click to enlarge the chart and apply filters by substance category or generic substance, age, route, triage recommendation, outcome, month/year, etc.
KPIs
Key facts and performance indicators for completed, nonduplicated webPOISONCONTROL cases.
Click to enlarge the chart and apply filters to get quick facts about subsets of data.
Triage follow-up and outcomes
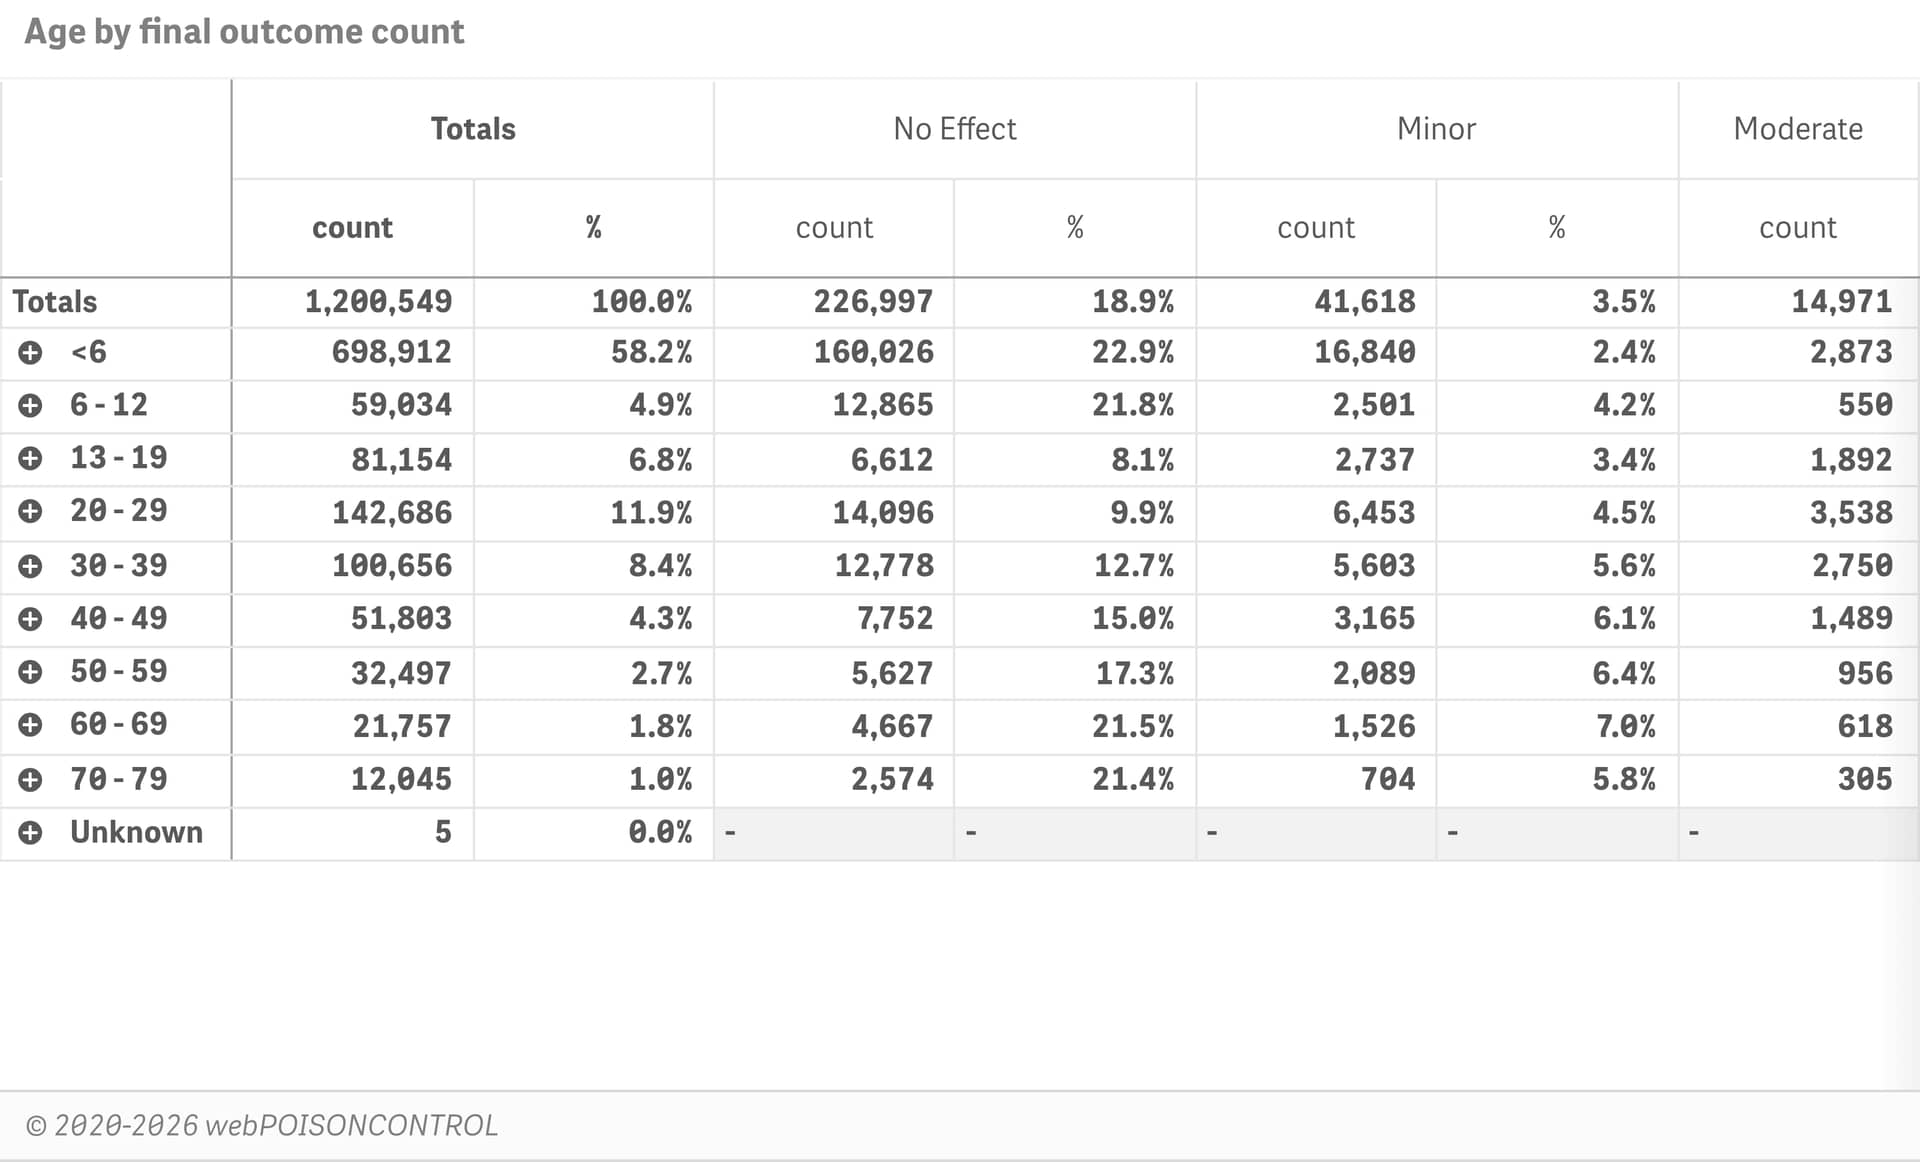
Final outcome by age
Click to display a hierarchical table of age by outcome.
Apply filters to display selected data, such as year, sex, substance category, route, etc.
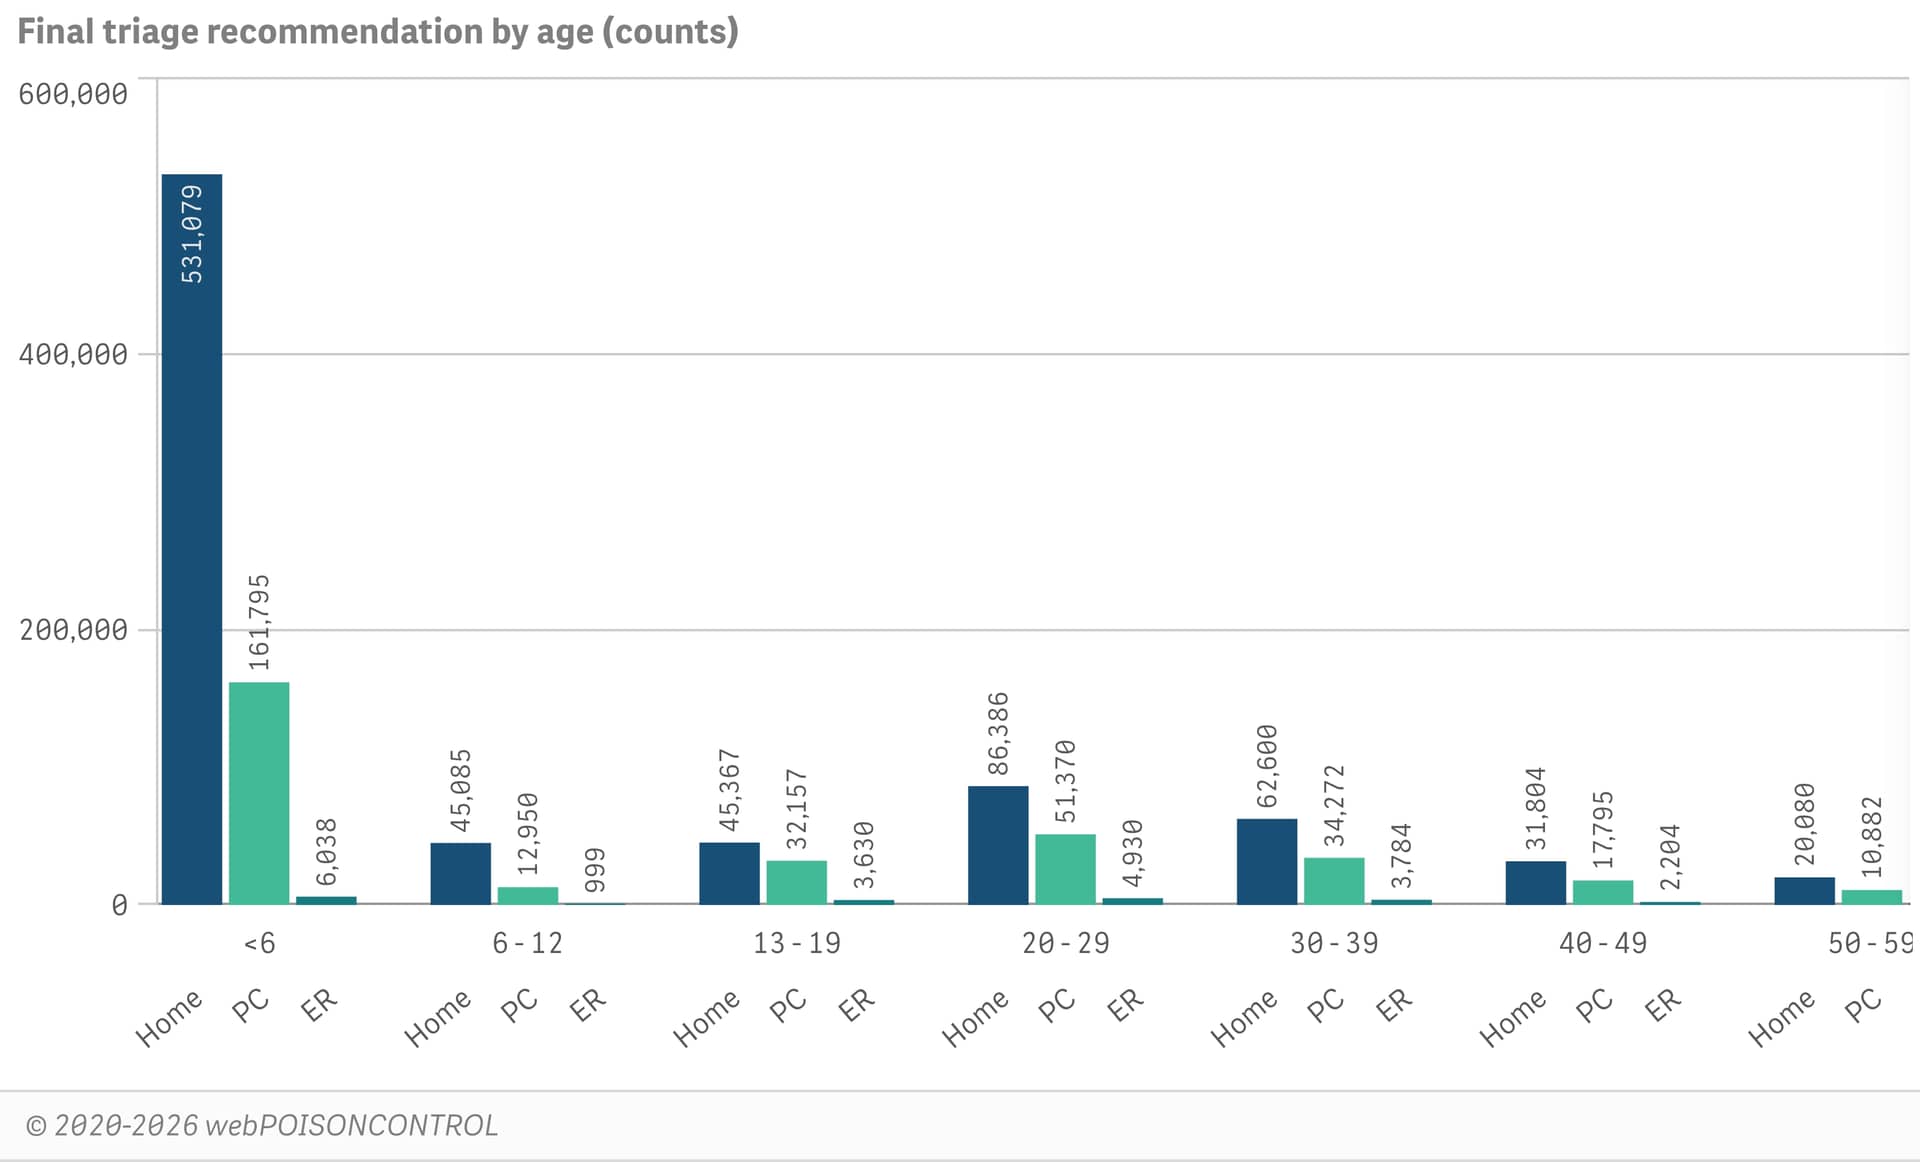
Final triage recommendation by age
Click to display 2 bar charts showing final triage recommendation by age (counts) and by percent of age group.
Apply filters to display selected data, such as year, sex, substance category, route, double dosing, etc.
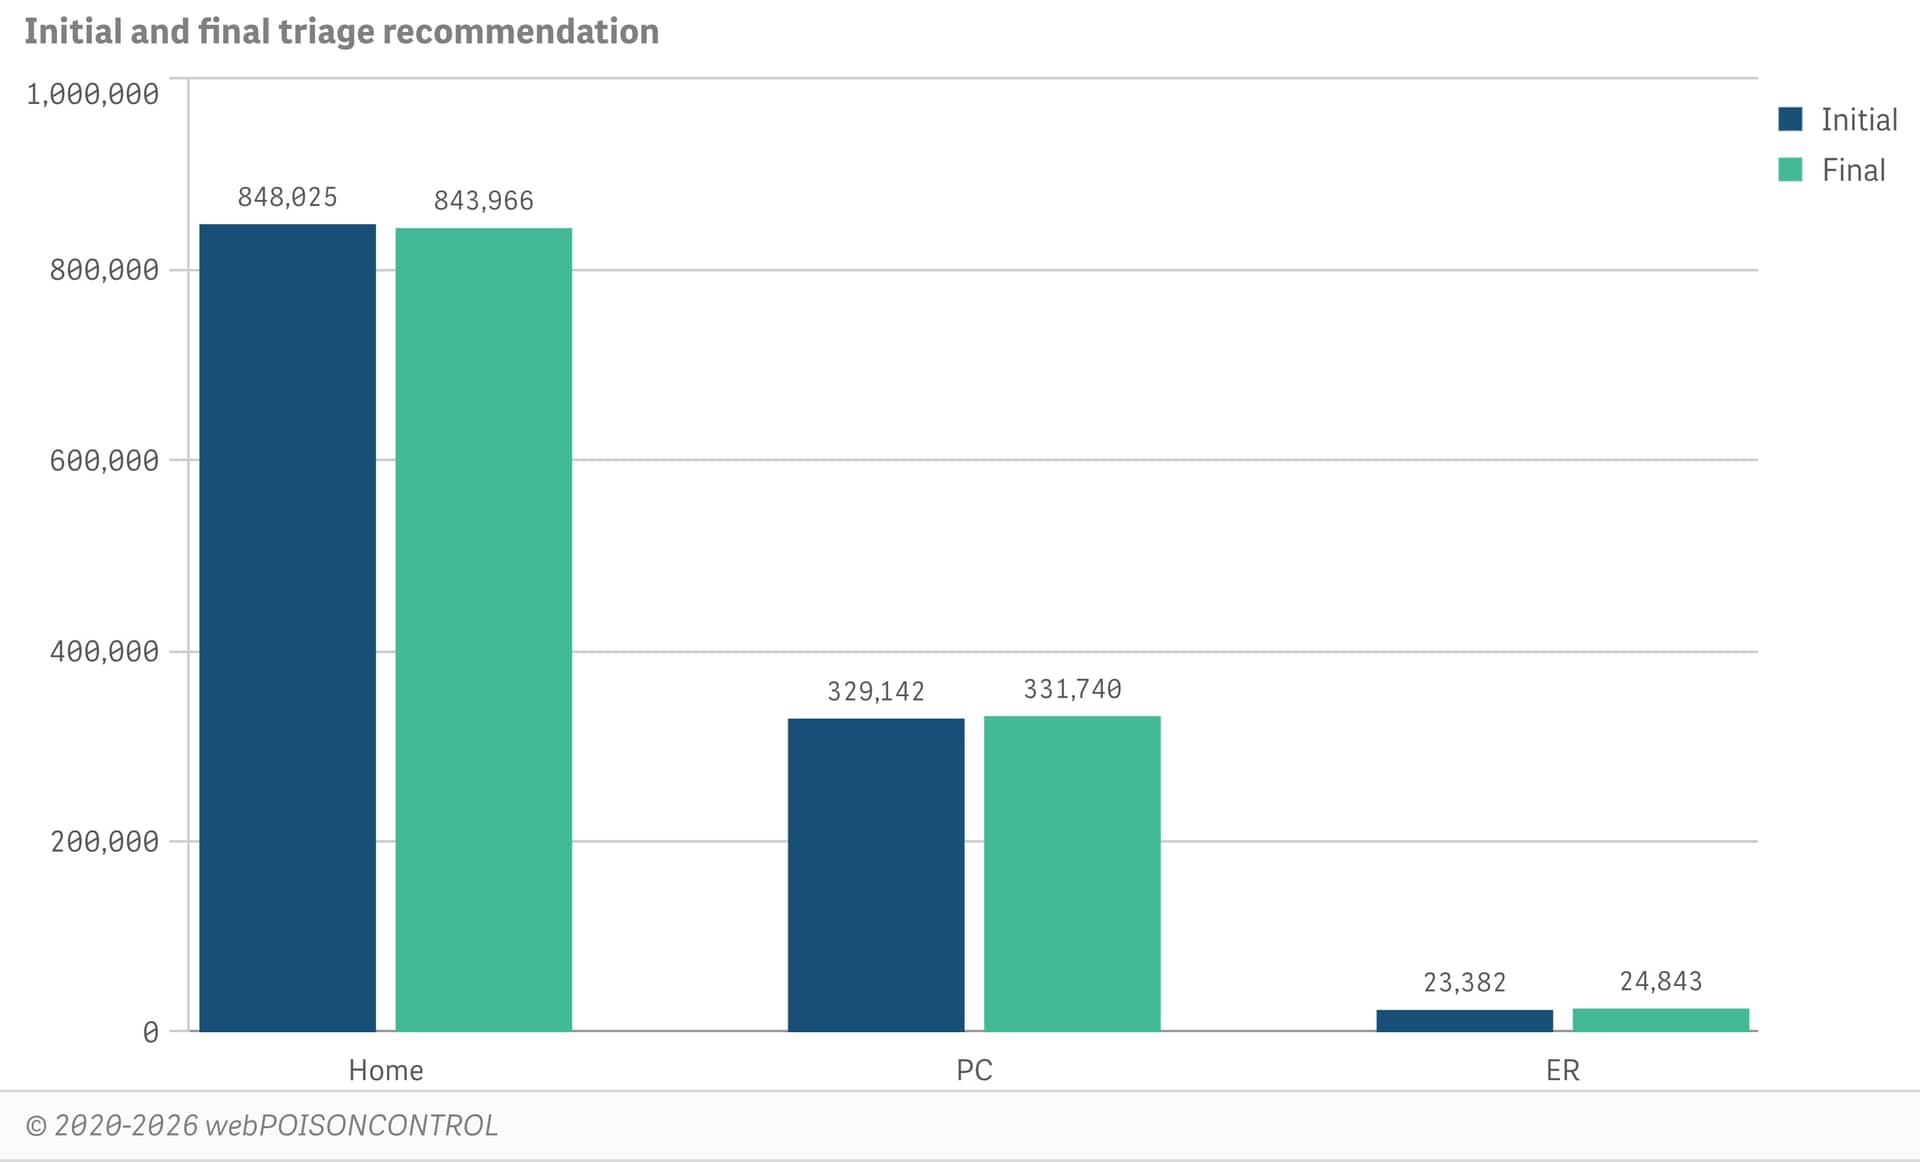
Initial and final triage recommendation
Click to see a bar graph showing the difference between the initial and the final triage recommendation for cases triaged to stay home, call a poison center, or go the ER.
Apply filters to display selected data, such as year, age, sex, initial triage recommendation, outcome, substance category, etc.
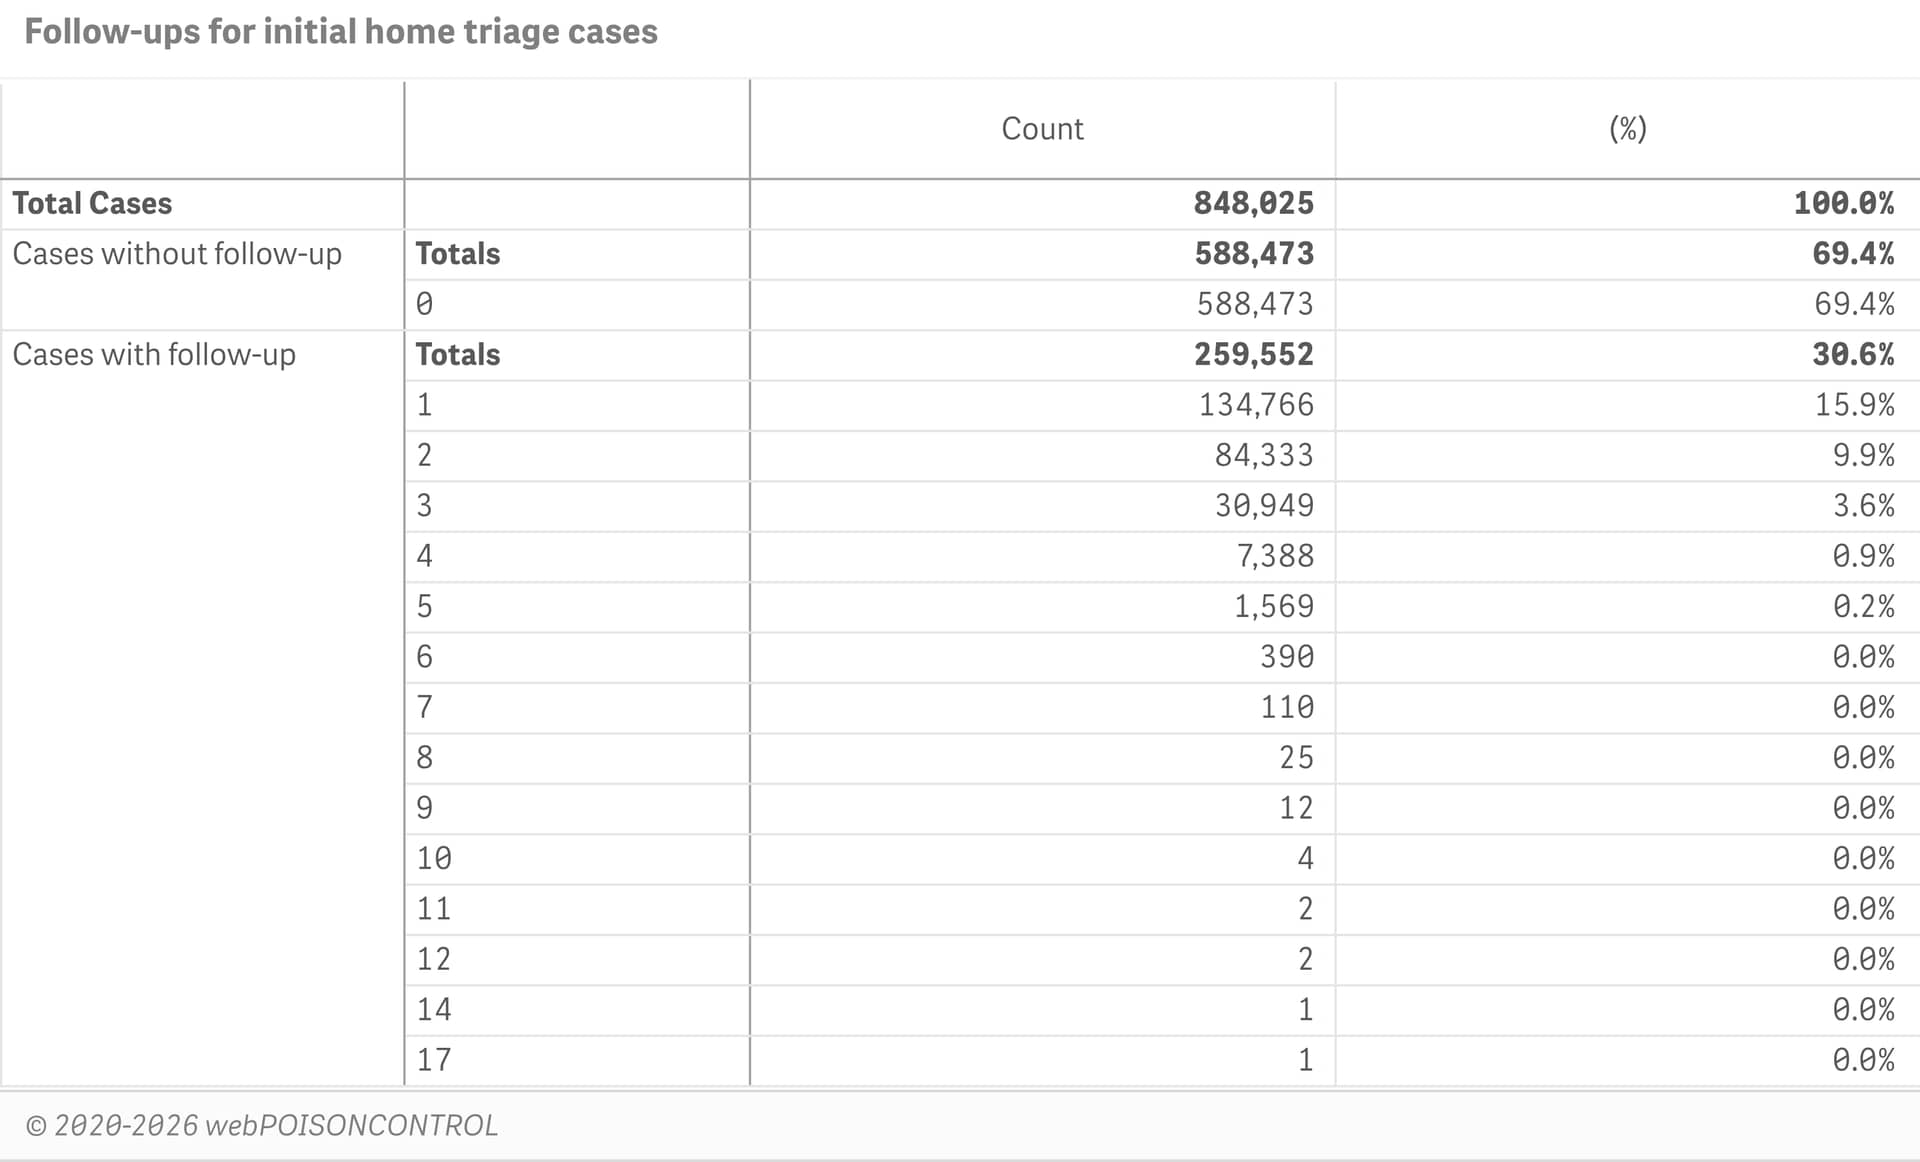
Initial home triage cases follow-up
Click to show the number of follow-ups completed for each home-triaged case.
Apply filters to display selected data, such as year, age, sex, substance category, route, double dose cases, etc.
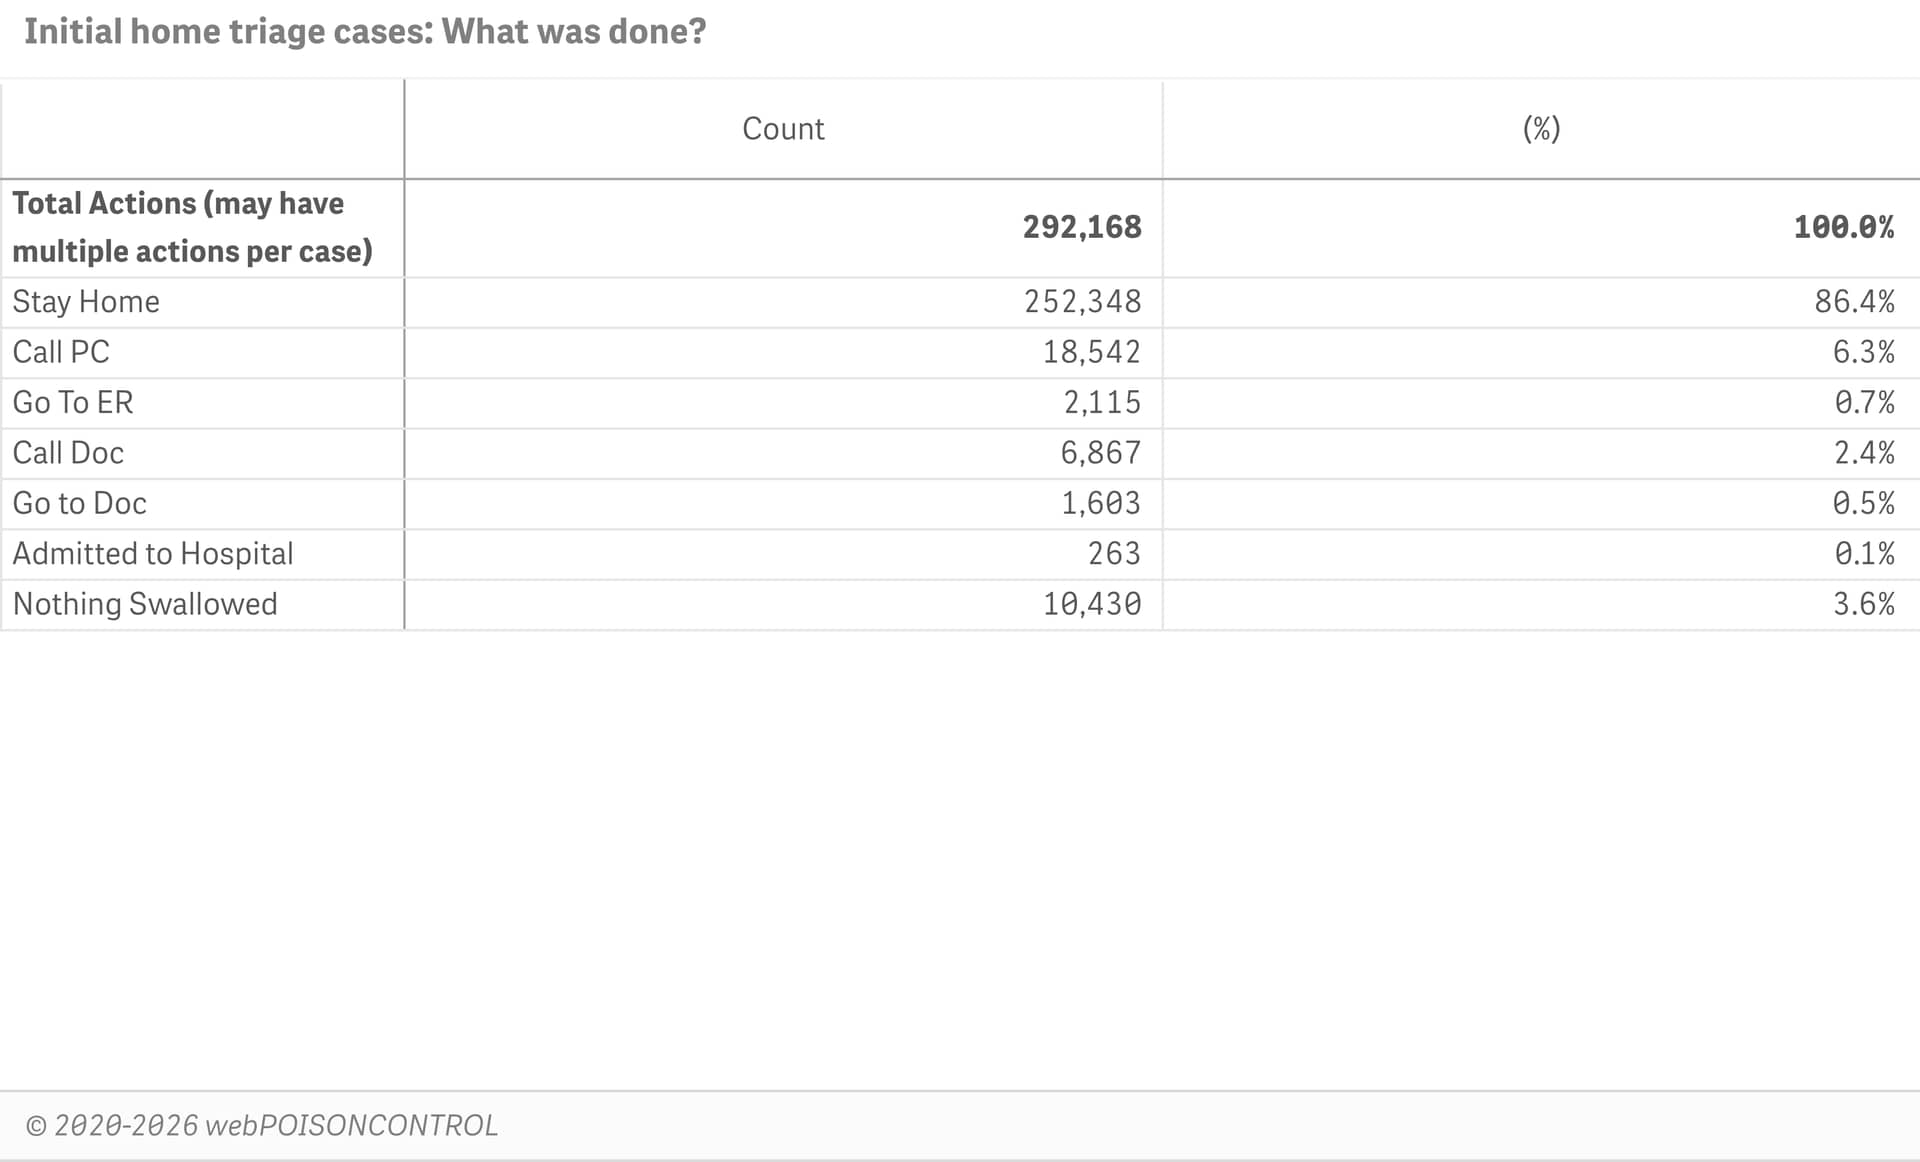
Initial home triage cases: What was done?
Click to display a table analyzing what was actually done by home-triaged cases. Did they stay home, call a poison center, go to an ER, call a doctor, or get admitted to a hospital?
Apply filters to analyze a subset of the data, such as by year, age, substance category or route.